Published
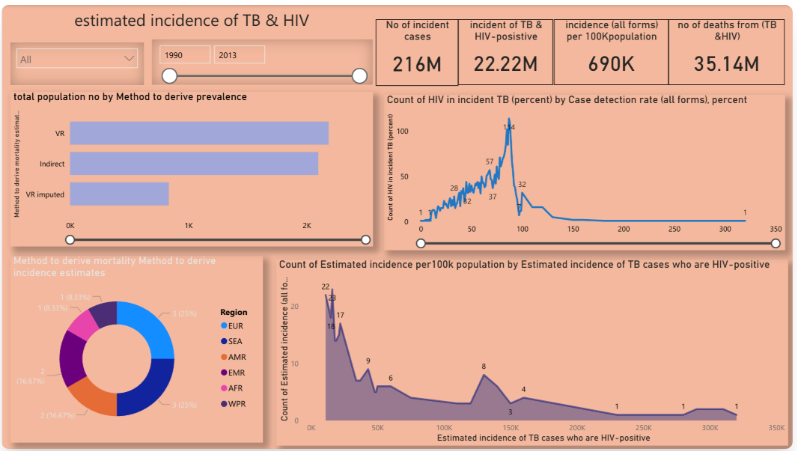
The TB HIV is a public health epidemiology Power BI theme engineered for epidemiological research, infectious disease analytics, and global health reporting dashboards where a professional, research-oriented visual environment needs to present incidence rate data, case count distributions, mortality statistics, and population prevalence trends with the analytical depth, structural clarity, and formal reporting standards that serious public health intelligence and healthcare policy reporting demands. This Power BI theme establishes a warm peach background canvas with muted cream visual containers — a distinct yet professionally composed foundation that separates this theme from clinical grey reporting environments — enriched by deep blue and indigo accent tones that emphasise critical epidemiological KPIs and reinforce the data-centric focus that TB and HIV incidence reporting requires across every chart, distribution graph, and regional breakdown visual. The carefully structured complementary colour system — deploying deep blue and indigo for headline incidence and mortality indicators, with purple, teal, and magenta tones differentiating regional distributions, trend patterns, and demographic breakdowns — creates a precise, multi-dimensional visual environment where complex epidemiological data across geographies, population segments, and time periods remains clearly distinguishable and immediately interpretable. Strong blue callout numbers on KPI cards ensure critical public health metrics command immediate analytical attention, while subtle brown-toned typography provides formal contrast without visual harshness — maintaining the measured, research-grade composure that epidemiological dashboard reporting demands across all stakeholder environments. It is particularly well-suited to public health ministries, global health research institutions, epidemiology departments, infectious disease analytics organisations, and international health development agencies building dashboards for TB incidence trend analysis, HIV prevalence reporting, mortality rate tracking, regional case distribution mapping, and population health outcome measurement. Epidemiologists, public health data leads, and global health policy directors who need reports that communicate the analytical rigour, research credibility, and institutional authority of serious infectious disease intelligence within a warm, professionally structured visual environment will find this palette a precisely calibrated and deeply purposeful fit. The theme is delivered as a JSON file fully compatible with all versions of Power BI Desktop and ready to deploy across your complete public health analytics and epidemiological reporting suite in seconds. Download this public health epidemiology Power BI theme, import the JSON file into Power BI Desktop, and give your TB HIV and infectious disease dashboards the warm, research-grade visual identity that serious epidemiological analytics and global public health reporting demands
Category
Themes
Chart Types
Bar, Line, Area, Donut
Industry Types
Healthcare
Main Colors
#FFA500
Mode
light
Version
Free
JSON File
🔑 Sign in to Download