Published
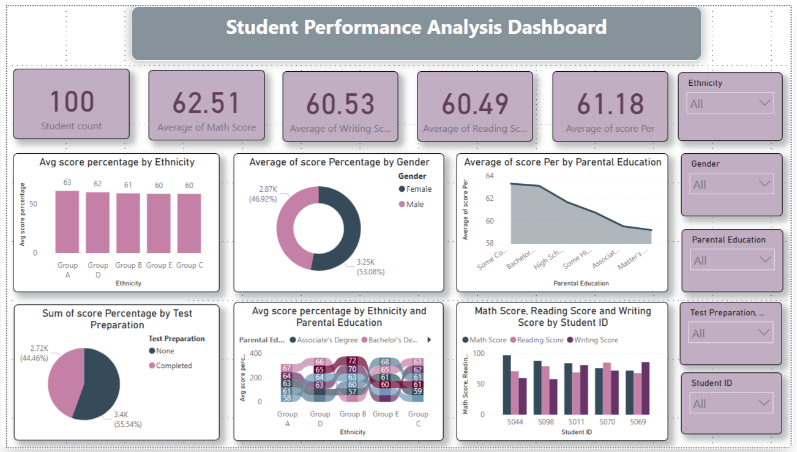
The Student Performance is an academic purple Power BI theme crafted for education analytics, institutional assessment, and student performance reporting dashboards where a soft, knowledge-focused visual environment needs to present subject score comparisons, demographic breakdowns, and academic outcome KPIs with the structured clarity, pastel-toned approachability, and professional academic aesthetic that educational research and institutional reporting demands. This Power BI theme establishes a light neutral background enriched by a primary lavender and muted purple palette — tones that instinctively symbolise knowledge, creativity, and structured learning — while carefully selected complementary pink and blue accent colours provide clear differentiation across subject score comparisons, gender analytics, ethnicity distributions, and parental education influence metrics throughout every chart, KPI card, and demographic breakdown visual. The soft pastel contrast system creates a report environment that feels academically considered and visually balanced — guiding institutional analysts, academic directors, and education policy leads through student attainment data, demographic performance comparisons, and subject score distributions with effortless readability and confident analytical clarity. Subtle pastel accent tones ensure KPI cards and comparative chart elements remain clearly distinguishable without overwhelming the clean, structured visual identity — maintaining the cohesive, education-focused aesthetic that serious academic performance reporting and institutional assessment dashboards require across every stakeholder presentation environment. It is particularly well-suited to schools, universities, educational research organisations, institutional assessment bodies, and academic analytics teams building dashboards for student attainment tracking, subject performance comparison, demographic achievement gap analysis, parental education influence reporting, and institutional academic KPI measurement. Academic directors, education data leads, and institutional research managers who need reports that combine a soft, knowledge-inspired visual identity with the structured analytical precision that serious student performance analytics and academic reporting demands will find this palette a precisely calibrated and immediately resonant fit. The theme is delivered as a JSON file fully compatible with all versions of Power BI Desktop and ready to deploy across your complete education analytics and student performance reporting suite in seconds. Download this academic purple Power BI theme, import the JSON file into Power BI Desktop, and give your student performance and education analytics dashboards the soft, lavender-toned visual identity that structured academic reporting and institutional assessment excellence demands
Category
Themes
Chart Types
Bar, Pie, Area, Donut
Industry Types
Education
Main Colors
#C2AEC2
Mode
light
Version
Free
JSON File
🔑 Sign in to Download