Published
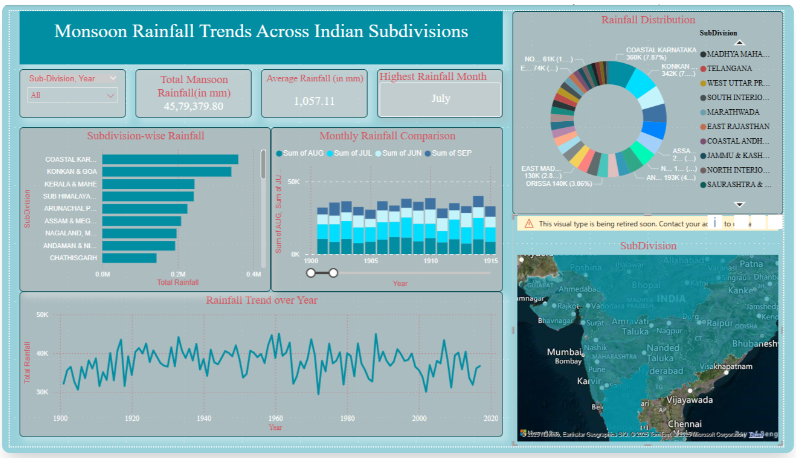
The Monsoon Rainfall is a monsoon rainfall Power BI theme crafted for climate analytics, environmental monitoring, and geographical weather reporting dashboards where the natural visual language of India's monsoon season — oceanic teals, rainfall blues, and soft aqua tones — needs to present seasonal precipitation data, monthly rainfall variation trends, and regional distribution patterns with the atmospheric authenticity, scientific clarity, and data-focused precision that serious climate and environmental reporting demands. This Power BI theme builds its palette around a primary oceanic teal that instinctively symbolises steady rainfall consistency and environmental depth — enriched by lighter rainfall blues and fresh cyan tones that represent monthly variation and seasonal shift patterns — while a light aqua background canvas maintains the weather-analytics aesthetic and neutral grey balance tones ensure strong chart and map readability across every visual element throughout the report environment. The carefully structured monsoon colour system — moving from deep teal rainfall anchors through mid-blue monthly variation tones to lighter cyan seasonal shift accents — creates a precise, atmospherically coherent visual environment that guides climate researchers, environmental analysts, and geographical data leads through precipitation trend comparisons, seasonal distribution charts, regional rainfall mapping, and time-series pattern analytics with effortless visual flow and confident scientific comprehension. Subtle coral accent highlights ensure that critical peak rainfall month indicators and anomalous precipitation metrics command immediate analytical attention without disrupting the cohesive, weather-focused character that defines the overall palette identity. It is particularly well-suited to meteorological research institutions, climate analytics organisations, environmental monitoring agencies, geographical data practices, and public sector weather reporting departments building dashboards for monsoon rainfall trend analysis, seasonal precipitation distribution reporting, regional climate comparison, peak rainfall period identification, and long-term weather pattern measurement. Climate scientists, environmental data leads, and geographical analytics managers who need reports that communicate the atmospheric authenticity, scientific rigour, and analytical depth of serious monsoon climate intelligence within a clean, professionally structured visual environment will find this palette a precisely calibrated and deeply purposeful fit. The theme is delivered as a JSON file fully compatible with all versions of Power BI Desktop and ready to deploy across your complete climate analytics and rainfall monitoring reporting suite in seconds. Download this monsoon rainfall Power BI theme, import the JSON file into Power BI Desktop, and give your climate and environmental dashboards the oceanic teal visual identity that atmospheric authenticity and professional monsoon rainfall analytics demands.
Category
Themes
Chart Types
Bar, Line, Map, Donut
Industry Types
Education, Entertainment & Media
Main Colors
#C3C9C9
Mode
light
Version
Free
JSON File
🔑 Sign in to Download