Published
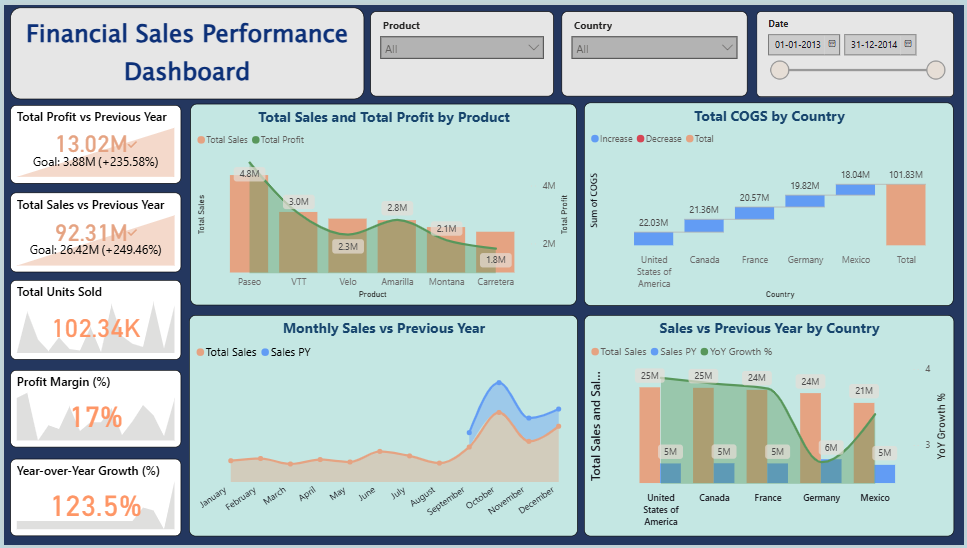
The Financial Sales Performance Dashboard provides a clear overview of the company’s sales and profitability across products, countries, and time periods. It highlights key KPIs such as Total Sales, Total Profit, Units Sold, Profit Margin, and Year-over-Year Growth to monitor overall business performance. The visualizations compare current results with previous year data, helping identify growth trends, top-performing products, and regional performance differences. The dashboard uses a dark executive theme with a navy background and soft teal panels, while orange, green, and blue accent colors differentiate sales, profit, and comparison metrics for better readability. Its clean layout and interactive slicers make it suitable for executive reporting and data-driven decision-making.
Category
Themes
Chart Types
Bar, Line
Industry Types
Finance
Main Colors
Blue, Yellow, #243A5E
Mode
dark
Version
Pro
JSON File
🔑 Sign in to DownloadBuy this Theme