Published
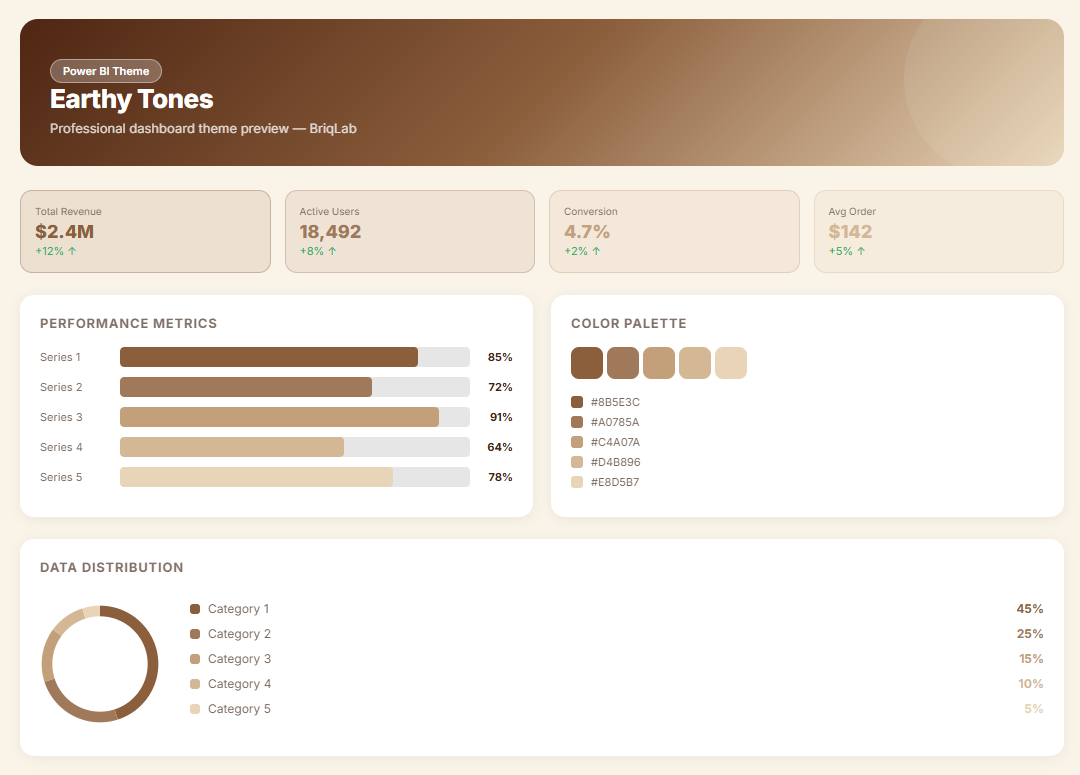
A terracotta warm Power BI theme crafted for agriculture, food industry, and natural produce dashboards where the visual environment needs to feel as grounded, organic, and authentically connected to the natural world as the land, produce, and food systems being reported on. This Power BI theme draws from a considered palette of sun-baked terracotta, rich sienna, warm clay, and dry ochre tones set against composed earthy neutral backgrounds — a combination that carries an innate sense of soil, season, and the enduring rhythms of agricultural and food production cycles. The organic warmth of the terracotta and sienna palette creates a report environment that feels honest, grounded, and contextually native to food and agricultural data — guiding farm managers, food producers, and supply chain analysts through crop yield metrics, harvest performance data, and food production KPIs with a visual language that reflects the natural world the numbers represent. Deeper sienna accent tones provide clear structural hierarchy and data differentiation across report layers while reinforcing the cohesive, earthy character of the overall design. It is particularly well-suited to agricultural cooperatives, organic food brands, farm management organisations, food manufacturers, and rural enterprise businesses building dashboards for crop production tracking, soil health analytics, harvest yield reporting, food supply chain performance, and seasonal trading measurement. Sustainability-focused food businesses and farm-to-table organisations who need reports that visually reinforce their connection to natural, organic processes will find this palette a grounded and immediately resonant fit. The theme is delivered as a JSON file fully compatible with all versions of Power BI Desktop and straightforward to deploy across your complete report suite in seconds. Download this terracotta warm Power BI theme, import the JSON file into Power BI Desktop, and give your agriculture and food industry dashboards the warm, organic visual identity that connects every data point authentically to the natural world it represents.
Category
Themes
Chart Types
Bar, Donut
Industry Types
Agriculture & Food
Main Colors
#FAF3E8
Mode
light
Version
Pro
JSON File
🔑 Sign in to DownloadBuy this Theme