Published
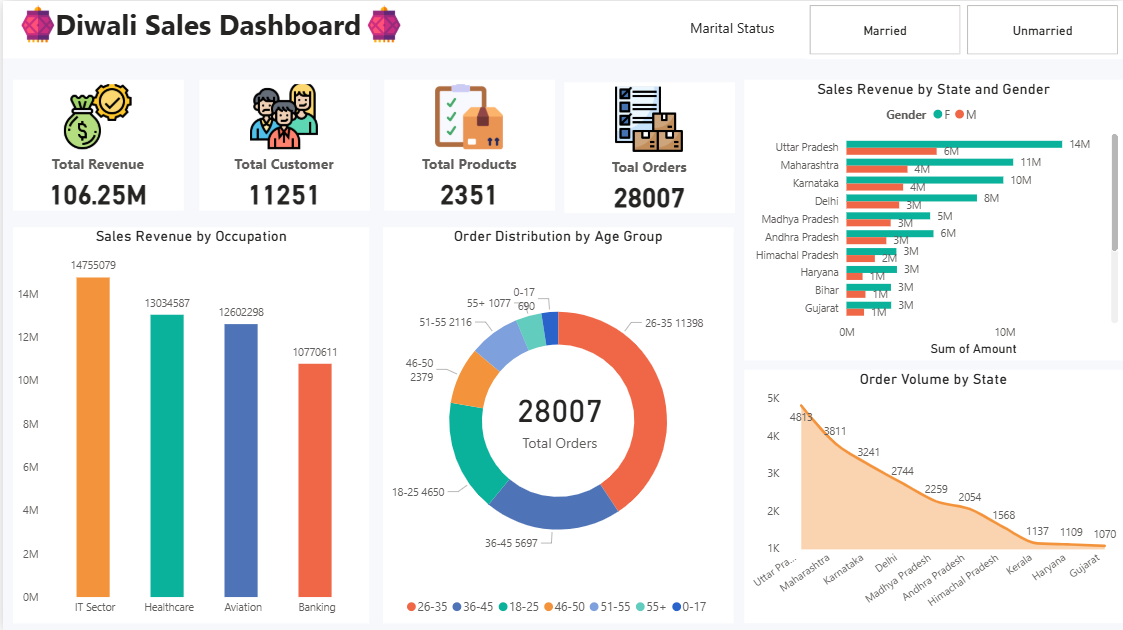
The Diwali Sales Dashboard provides a detailed analysis of festive season sales performance, highlighting total sales, customer distribution, and product category trends. It visualizes revenue breakdown by state, gender, occupation, and age group to identify high-performing customer segments. The dashboard uses interactive filters to explore demographic insights and purchasing behavior, helping businesses optimize festive marketing strategies and inventory planning.
Category
Themes
Chart Types
Bar, Line, Donut
Industry Types
Sales
Main Colors
Yellow, #FF1493
Mode
light
Version
Pro
Total Views
2
Total Downloads
0
JSON File
🔑 Sign in to DownloadOpen in Studio
🔑 Sign in to Open Studio
System Briqlab
System Briqlab
Skills