Published
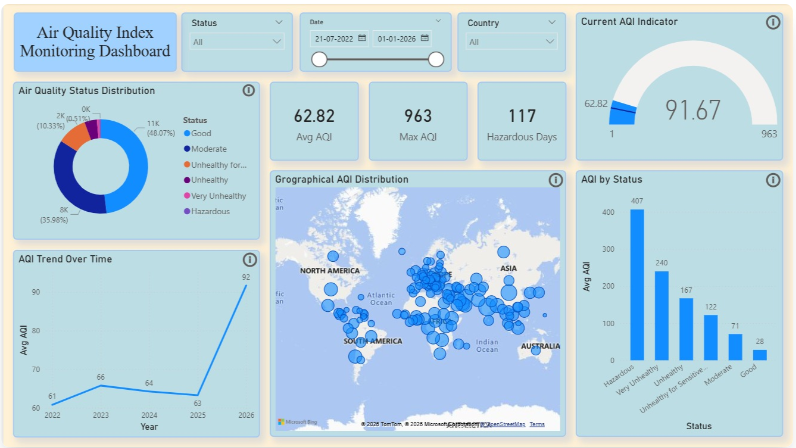
The AQI Monitoring is an environmental AQI Power BI theme crafted for air quality monitoring, atmospheric analysis, and public health environmental dashboards where cool sky blue clarity, soft teal analytical depth, and a precisely structured hazard accent system need to present AQI category data, geographical air quality comparisons, and environmental trend analytics with the professional precision, visual hierarchy, and atmospheric clarity that serious environmental monitoring and public health reporting demands. This Power BI theme establishes a muted cream background foundation enriched by dominant sky blue tones and soft teal panel surfaces — a combination that instinctively symbolises atmospheric clarity, environmental monitoring authority, and the clean analytical focus that air quality intelligence reporting requires — while carefully deployed coral and purple accent tones provide immediate, intuitive visual differentiation for critical AQI hazard categories including unhealthy and hazardous air quality level indicators. The considered interplay between cool sky blues, soft teal panel layers, muted cream background contrast, and hazard-signal accent tones creates a report environment that feels simultaneously modern, environmentally focused, and analytically rigorous — guiding environmental scientists, public health analysts, and sustainability directors through AQI trend comparisons, geographical distribution maps, category breakdown charts, and global air quality performance analytics with effortless visual flow and confident data comprehension. Lighter blue gradient layers enhance KPI card readability and chart clarity across both summary environmental overview and detailed atmospheric trend analysis dashboard layers. It is particularly well-suited to environmental monitoring agencies, public health organisations, government air quality departments, sustainability analytics practices, and geographical environmental research institutions building dashboards for AQI level tracking, atmospheric pollution trend analysis, hazardous air quality alert reporting, regional air quality comparison, and global environmental health measurement. Environmental data leads, public health directors, and sustainability analytics managers who need reports that communicate the atmospheric clarity, scientific rigour, and public health consequence of serious air quality monitoring intelligence will find this palette a precisely calibrated and immediately purposeful fit. The theme is delivered as a JSON file fully compatible with all versions of Power BI Desktop and ready to deploy across your complete environmental analytics and air quality monitoring reporting suite in seconds. Download this environmental AQI Power BI theme, import the JSON file into Power BI Desktop, and give your air quality monitoring and environmental dashboards the clean, sky blue visual identity that atmospheric clarity and professional public health environmental reporting demands
Category
Themes
Chart Types
Line, Map, Gauge, Donut
Industry Types
Healthcare, Energy
Main Colors
Blue
Mode
light
Version
Pro
JSON File
🔑 Sign in to DownloadBuy this Theme