Published
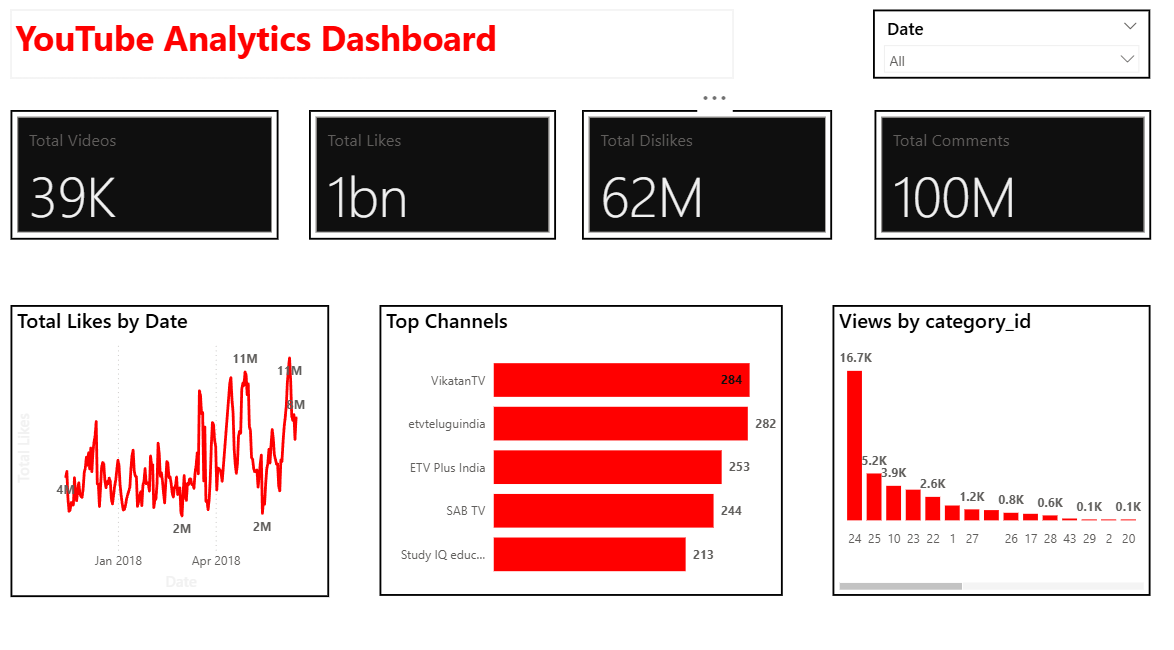
Summary: The Brilqab YouTube Analytics Dashboard is a high-performance Power BI solution designed to turn complex social data into actionable audience intelligence. This reporting tool provides a 360-degree view of channel health, helping brands maximize reach and engagement through data-driven content strategies. Strategic Performance Metrics: Engagement KPIs: Instant snapshots of total videos, likes, and comments to track channel growth. Trend Analysis: Time-based tracking of audience interaction to identify viral patterns and engagement peaks. Competitive Benchmarking: Comparative analysis of top-performing channels to evaluate market positioning. Category Insights: Granular breakdown of YouTube views to pinpoint high-growth content areas. Make it Yours: Download this Briqlab template to access the underlying DAX formulas and data architecture. Simply plug in your own YouTube API data or CSV exports to start optimizing your content strategy today.
Interactive Demo Available
Explore this dashboard live in Power BI
Category
Templates
Chart Types
Bar, Line
Industry Types
Information Technology
Main Colors
Red
Mode
light
Version
Free
PBIX File
🔑 Sign in to Download