Published
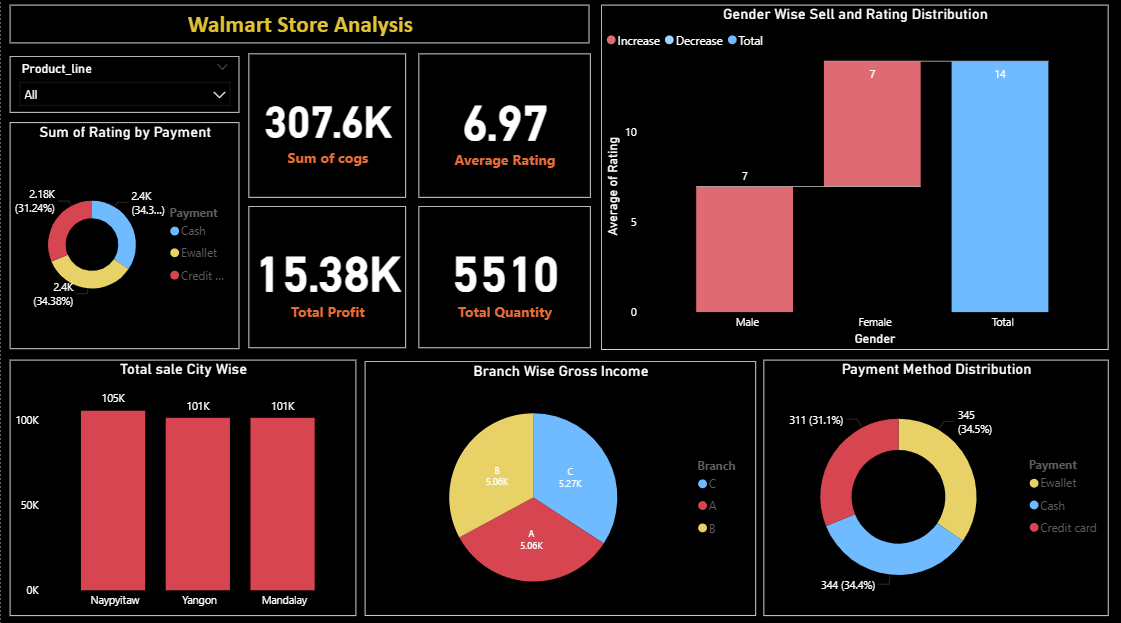
The Walmart Store Analysis Dashboard provides a comprehensive view of retail performance by analyzing sales, profit, quantity, customer ratings, and payment behavior across cities, branches, and genders. It highlights key KPIs such as total cost of goods sold, total profit, average rating, and total quantity sold, while visualizations break down sales by city, gross income by branch, gender-wise rating distribution, and payment method usage. Interactive filters enable focused product-level analysis, supporting data-driven insights into customer preferences, branch performance, and operational efficiency.
Interactive Demo Available
Explore this dashboard live in Power BI
Category
Templates
Chart Types
Bar, Pie, Donut
Industry Types
Retail
Main Colors
Red, #E8D166
Mode
dark
Version
Pro
PBIX File
🔑 Sign in to DownloadBuy this Dashboard