Published
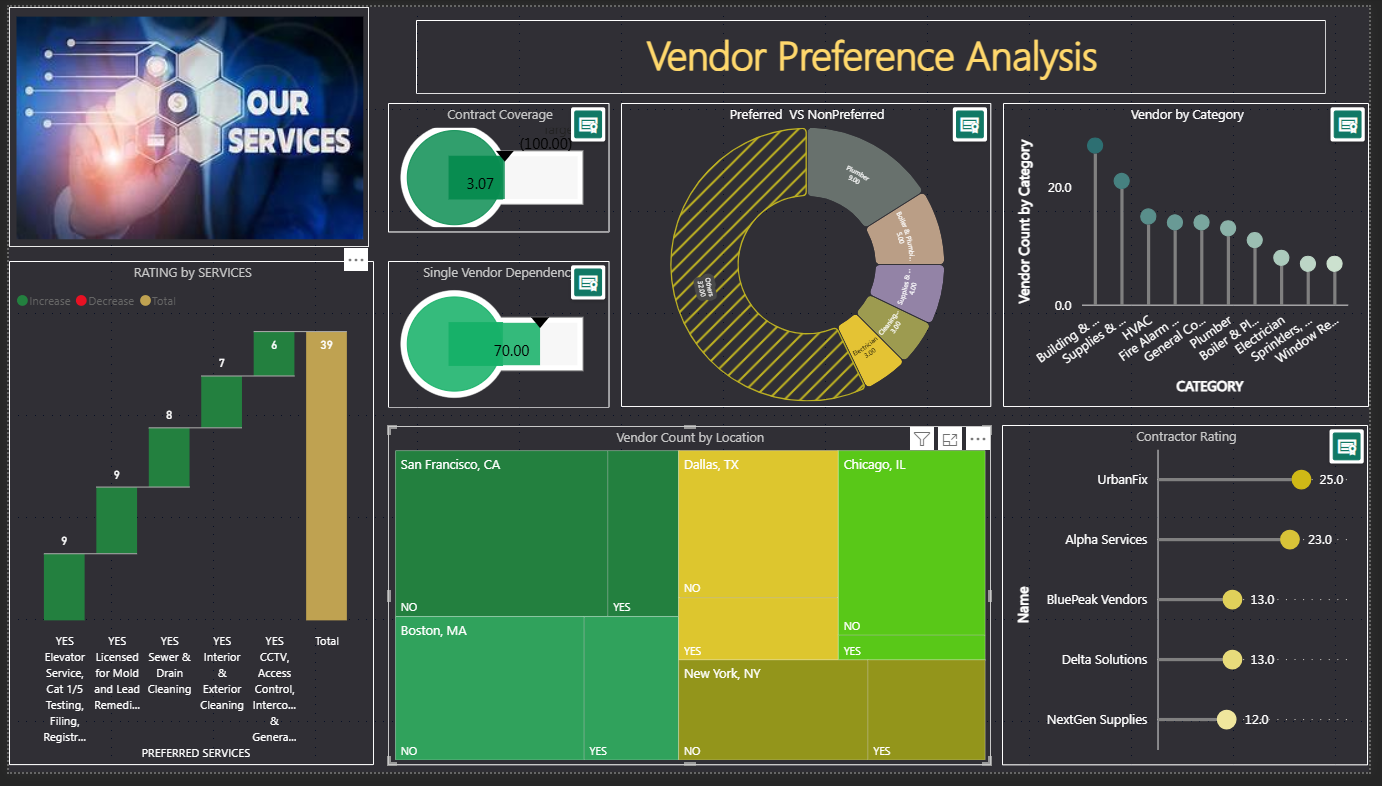
The Procurement Analytics Power BI Dashboard Template helps analyze vendor performance, service preferences, and contract coverage across locations and categories. This Procurement Analytics Power BI Dashboard Template includes key metrics such as preferred vs non-preferred vendors, contract coverage, vendor dependency, and contractor ratings to evaluate supplier performance effectively. It also highlights vendor distribution by service category and location along with preferred service analysis. Designed for procurement teams, supply chain managers, and business analysts, this Procurement Analytics Power BI Dashboard Template helps identify high-performing vendors, reduce dependency risks, and improve supplier selection. It solves challenges related to tracking vendor performance and optimizing procurement efficiency. The dashboard includes visuals such as vendor count by location charts, rating comparison graphs, category-based vendor analysis, and KPI cards for quick insights. Interactive filters allow users to explore data by service category, location, and vendor type for deeper analysis. Download this Procurement Analytics Power BI Dashboard Template and start analysing vendor performance and procurement efficiency today.
Interactive Demo Available
Explore this dashboard live in Power BI
Category
Templates
Chart Types
Gauge, Tree Map / Hierarchical Chart, Donut
Industry Types
Retail, Marketing, Agriculture & Food
Main Colors
#262626
Mode
dark
Version
Pro
PBIX File
🔑 Sign in to DownloadBuy this Dashboard