Published
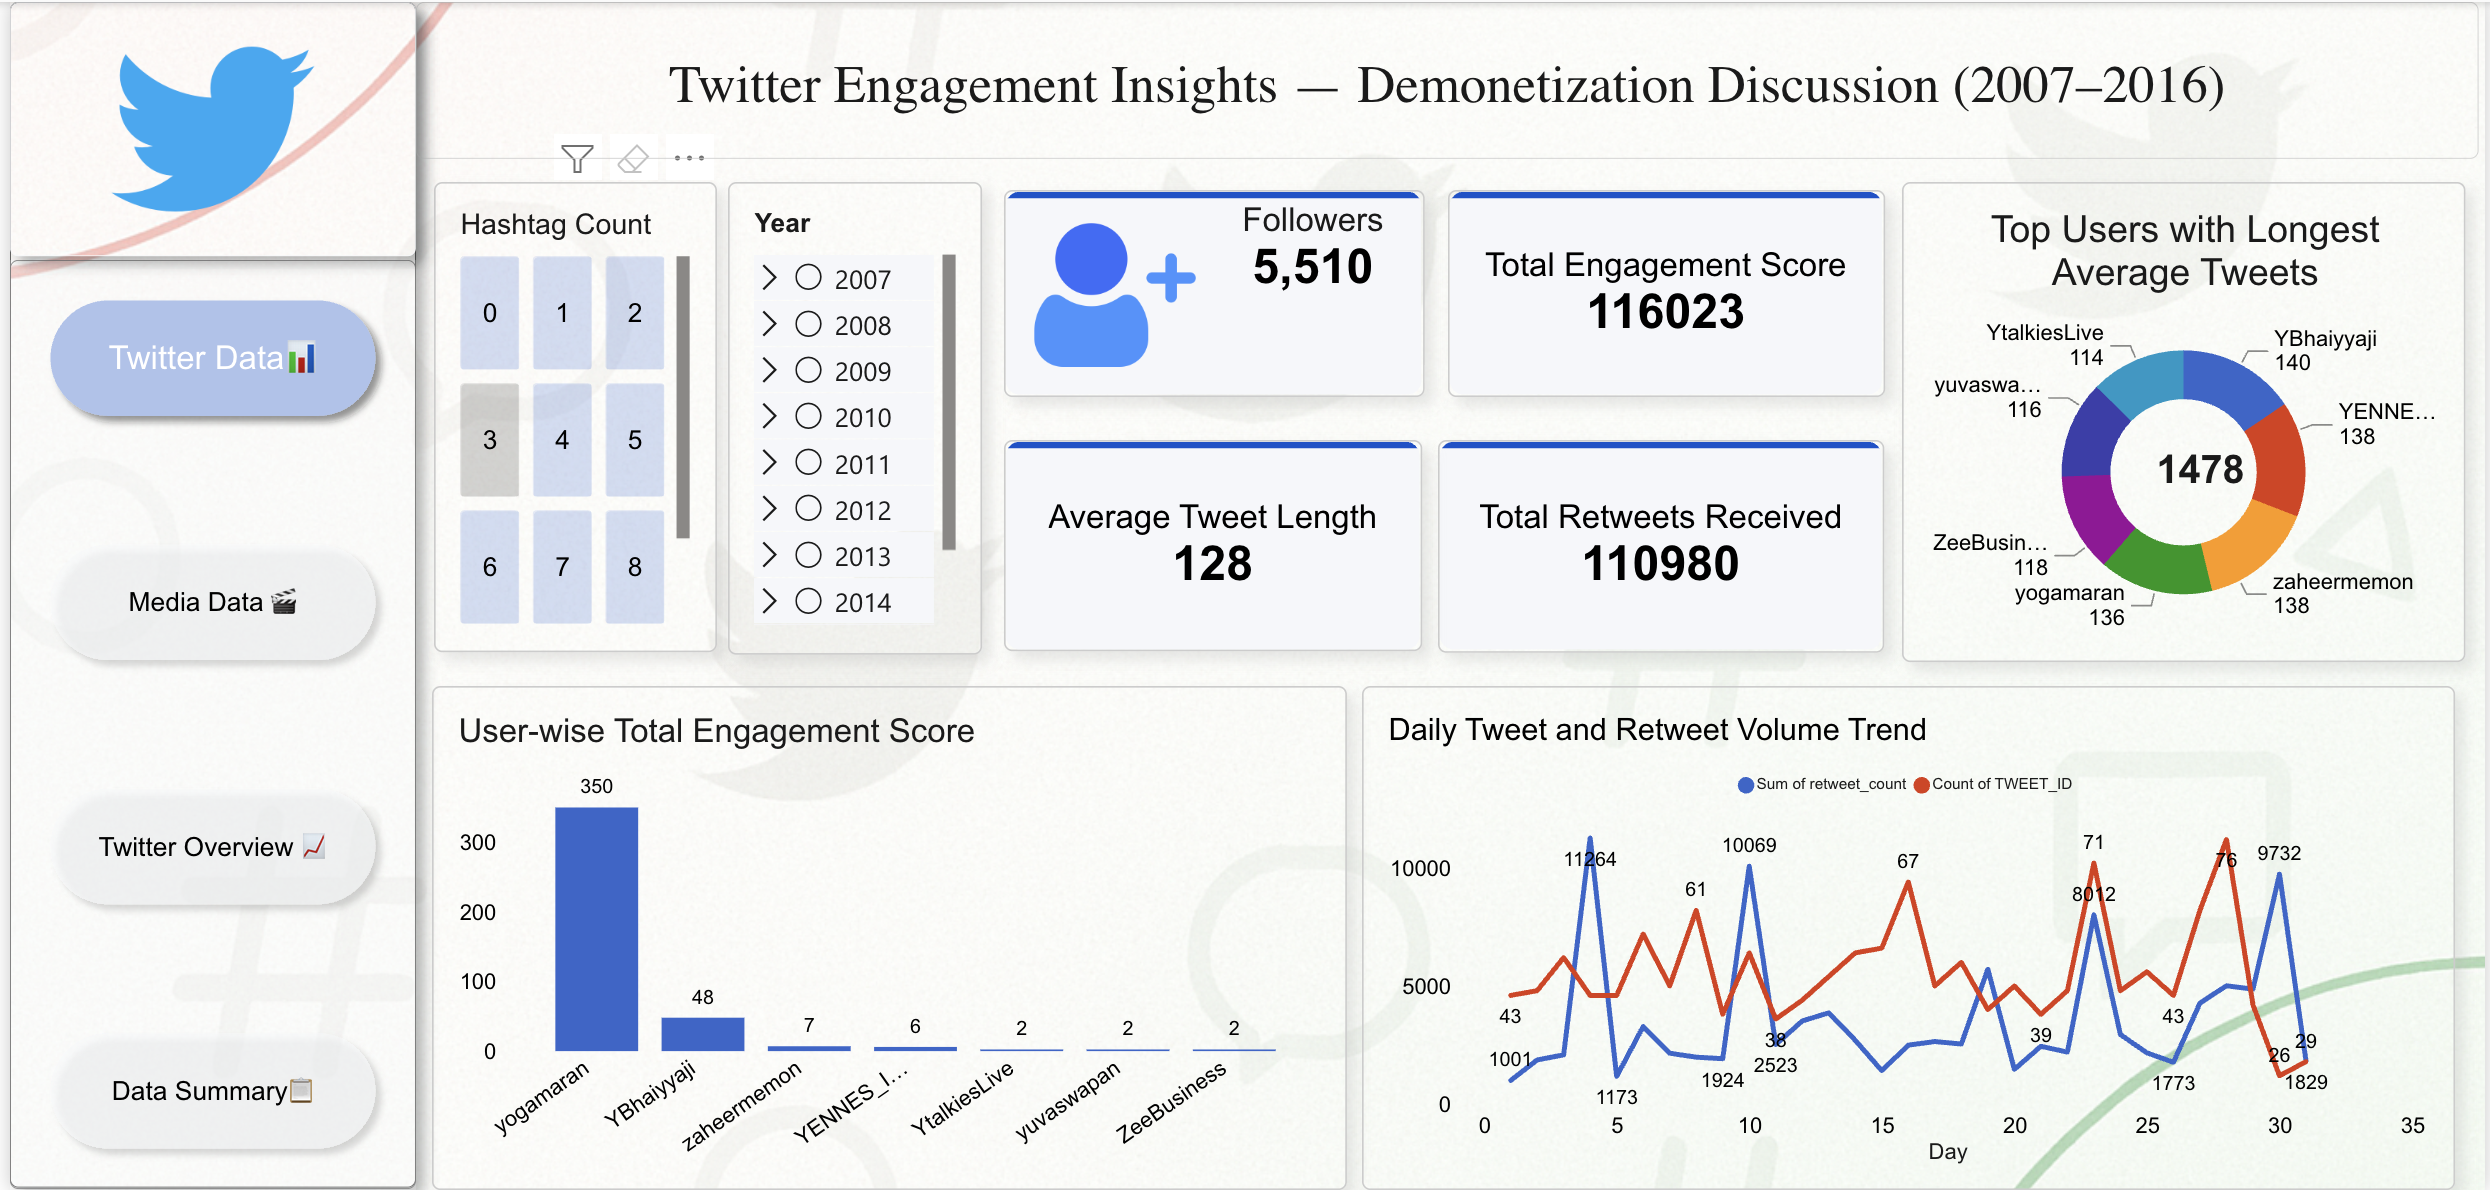
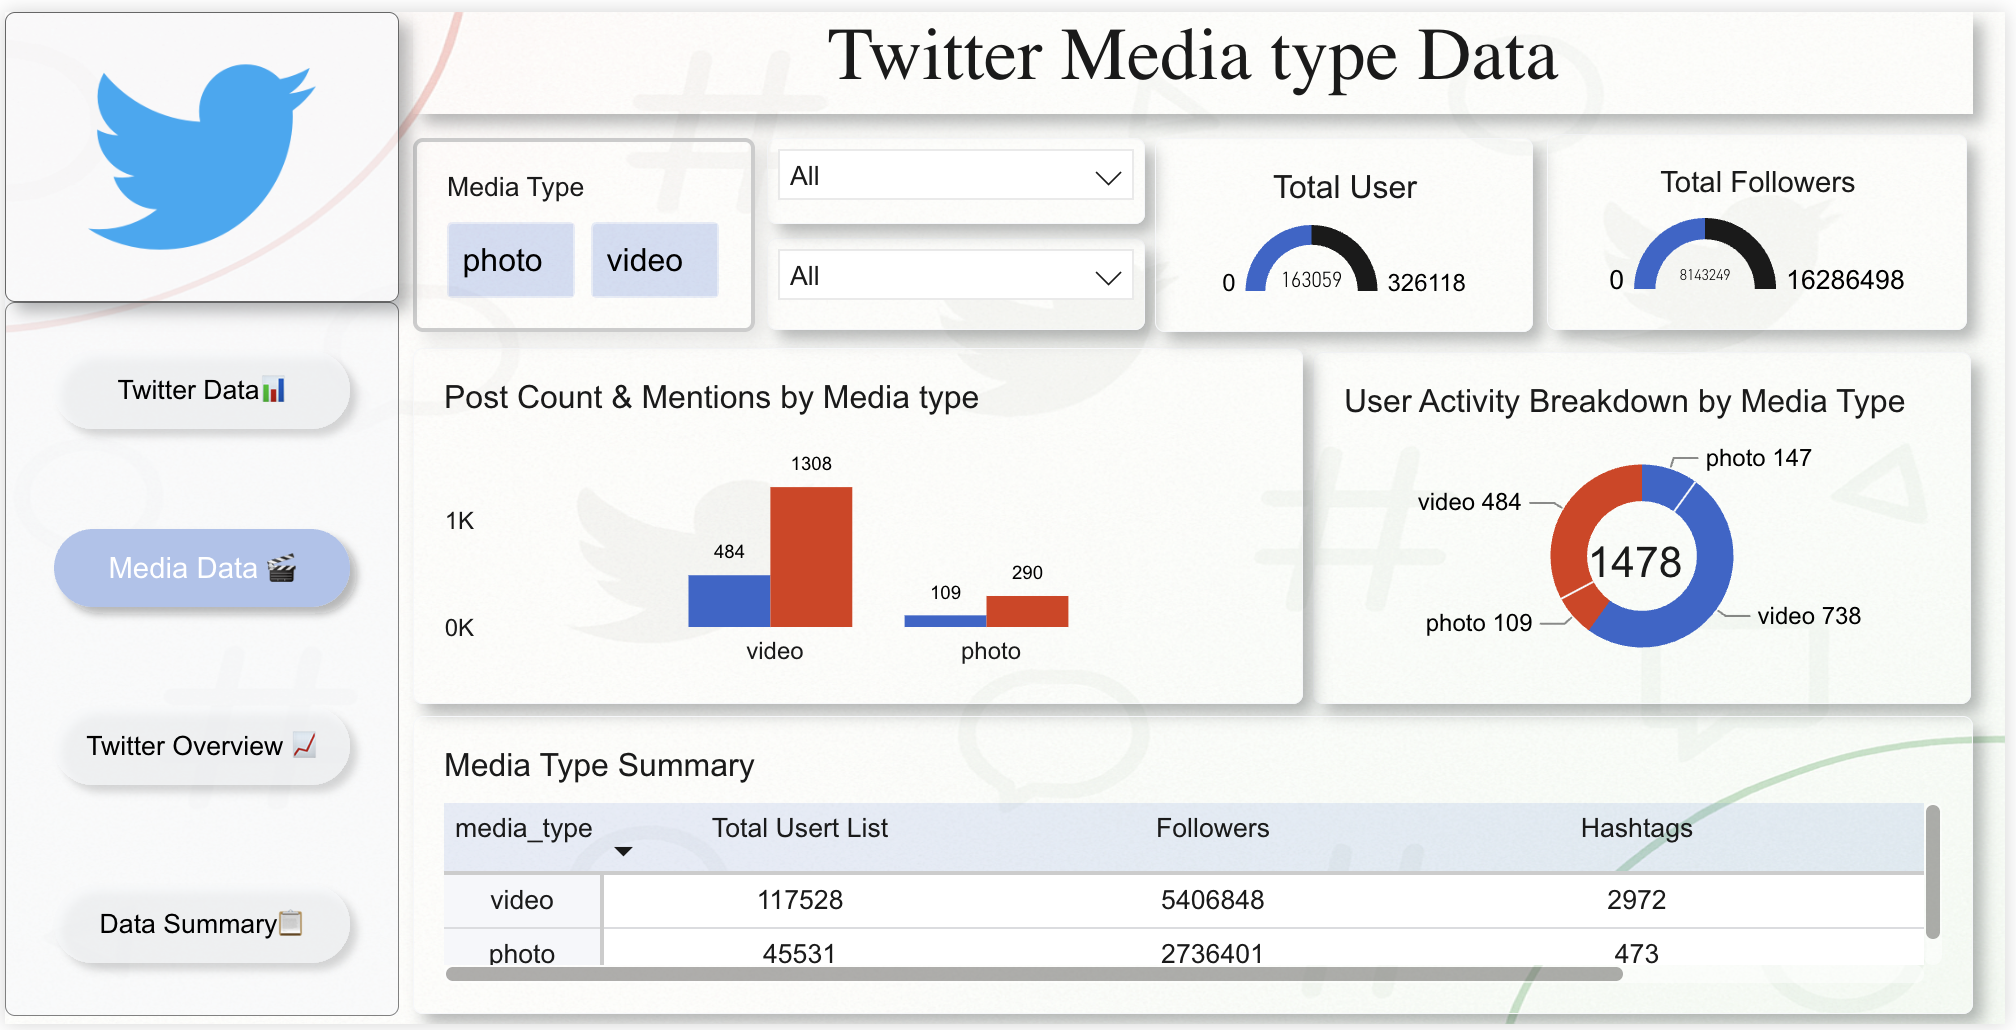
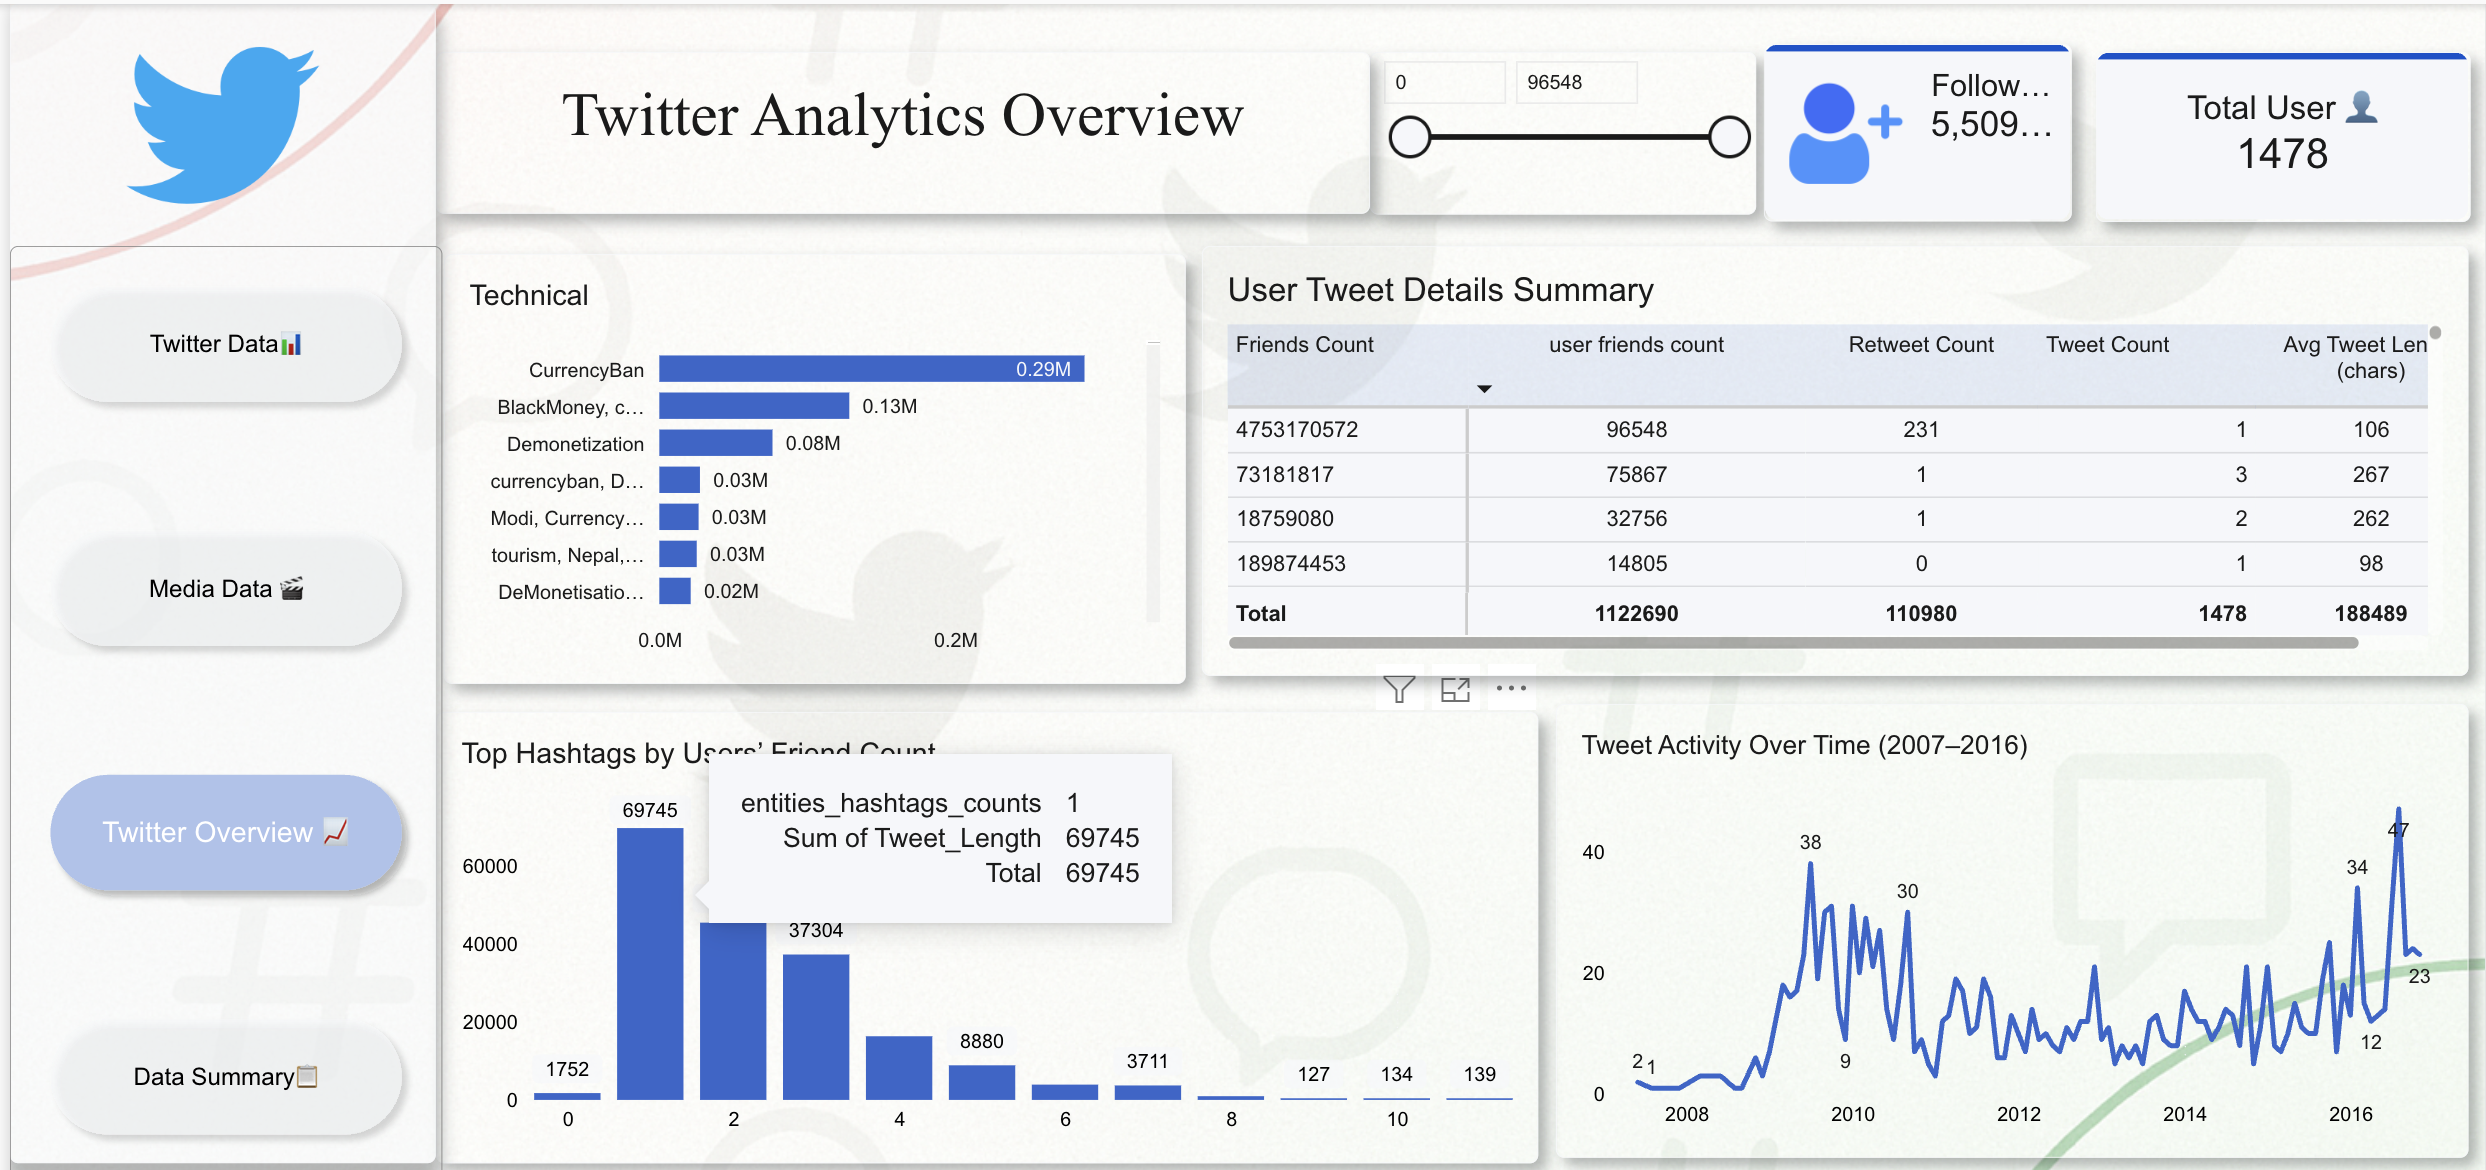
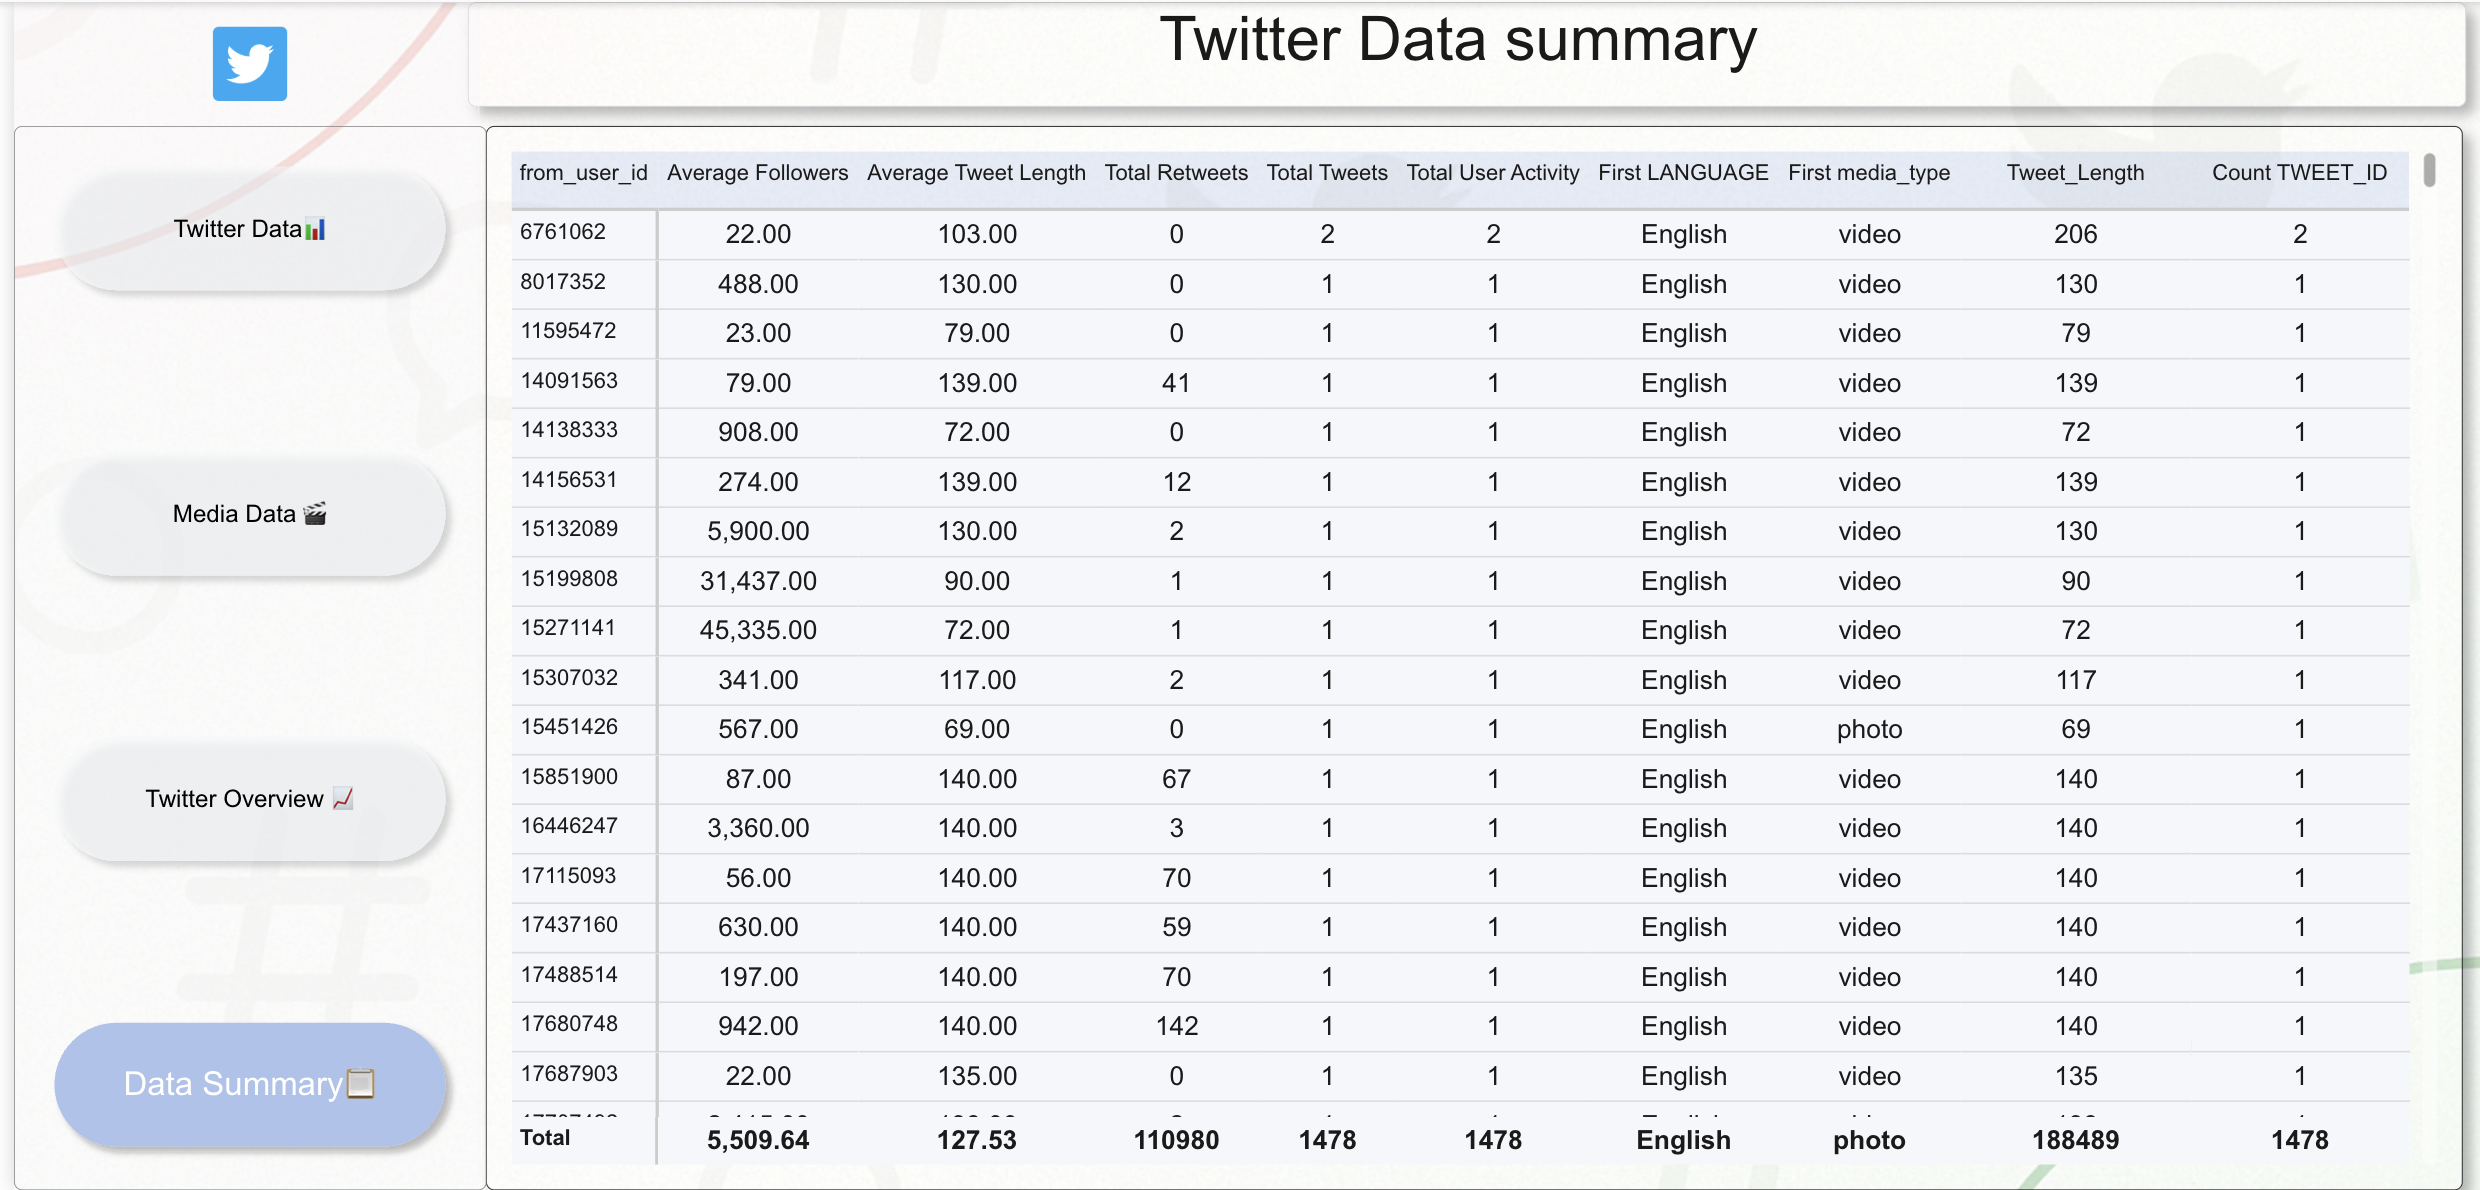
Analyse and evaluate Twitter activity, audience engagement, and media performance with this Twitter Analytics and Engagement Power BI dashboard template, built to give social media analysts, digital marketing teams, and communications professionals a structured, multi-page view of tweet trends, user interactions, and content performance over time. The dashboard tracks all essential social media KPIs including total followers, engagement scores, retweet counts, total tweet volume, and average tweet length — giving teams a clear picture of how content resonates with audiences and which users and hashtags drive the highest levels of interaction. Additional metrics cover daily tweet activity patterns, top-performing user rankings, hashtag distribution analysis, and media type engagement comparisons between photo and video content, helping digital marketing and communications teams refine content strategy and identify peak engagement windows. This template is designed for social media managers, digital marketing strategists, communications analysts, and brand researchers who need a reliable, visual tool for social listening, campaign evaluation, and audience behaviour analysis. Visuals include daily tweet activity line charts, hashtag performance bar charts, engagement score KPI cards, media type donut charts, retweet trend indicators, and gauge visuals — with interactive slicers for year, media type, hashtag, and user-level metrics enabling flexible drill-down exploration. Download this Twitter Analytics and Engagement Power BI dashboard template, open the PBIX file in Power BI Desktop, and start turning social data into smarter digital marketing decisions today.
Interactive Demo Available
Explore this dashboard live in Power BI
Category
Templates
Chart Types
Bar, Line, Gauge, Donut
Industry Types
Marketing, Entertainment & Media
Main Colors
#FDFBD4
Mode
light
Version
Pro
PBIX File
🔑 Sign in to DownloadBuy this Dashboard