Published
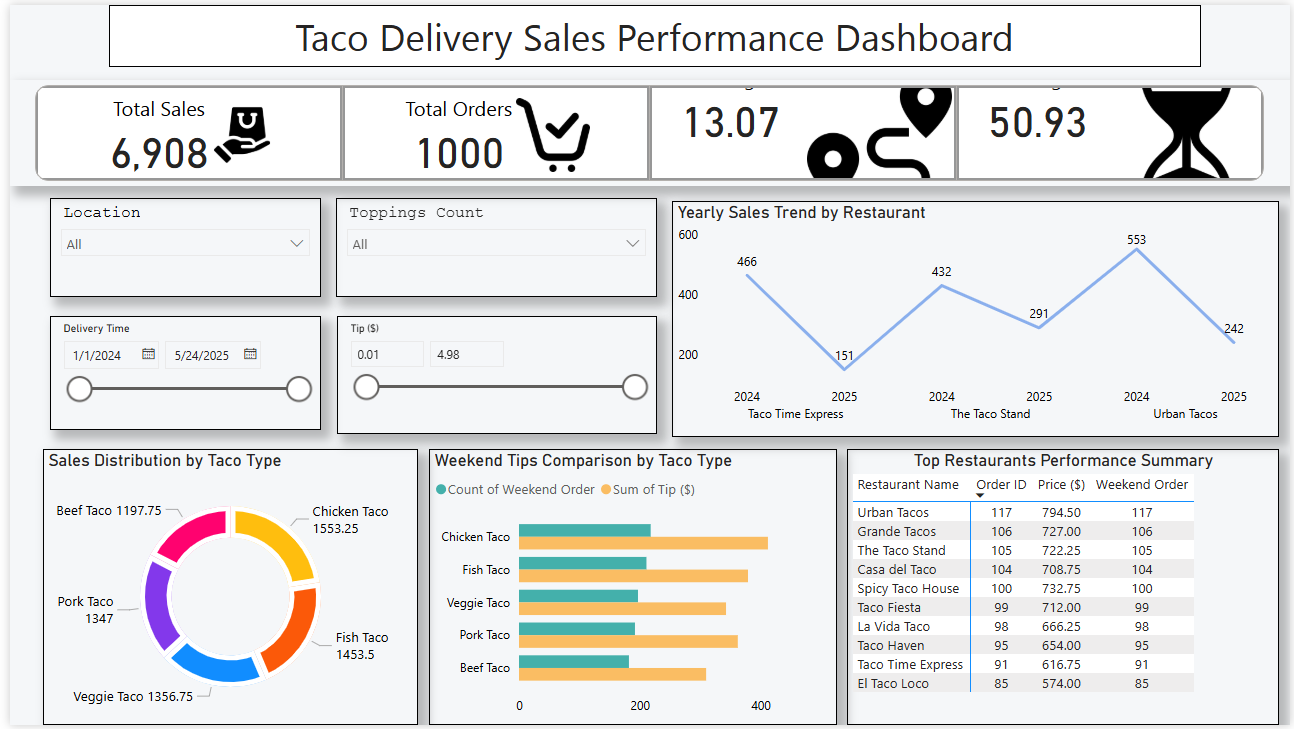
Track restaurant performance with this Food Delivery Sales Power BI dashboard template designed for taco delivery analytics and operational insights. This Food Delivery Sales Power BI dashboard template highlights key metrics such as total sales, total orders, average delivery time, and average preparation time to evaluate efficiency and performance. It also provides insights into customer preferences, sales contribution by taco type, and revenue trends across restaurants and locations. This Food Delivery Sales Power BI dashboard template is ideal for restaurant owners, delivery managers, and business analysts who need to monitor performance and optimise operations. It helps identify top-performing locations, understand demand patterns, and improve service efficiency based on data insights. The dashboard includes trend line charts for yearly sales, distribution charts for taco types, comparison visuals for weekend tips, and ranking tables for restaurant performance. Interactive filters for location, toppings, delivery date, and tip amount allow dynamic and detailed analysis. Download this Food Delivery Sales Power BI dashboard template and start tracking your restaurant sales and delivery performance effectively.
Interactive Demo Available
Explore this dashboard live in Power BI
Category
Templates
Chart Types
Bar, Line, Donut
Industry Types
Retail, Marketing, Agriculture & Food
Main Colors
#F5F7F9
Mode
light
Version
Pro
PBIX File
🔑 Sign in to DownloadBuy this Dashboard