Published
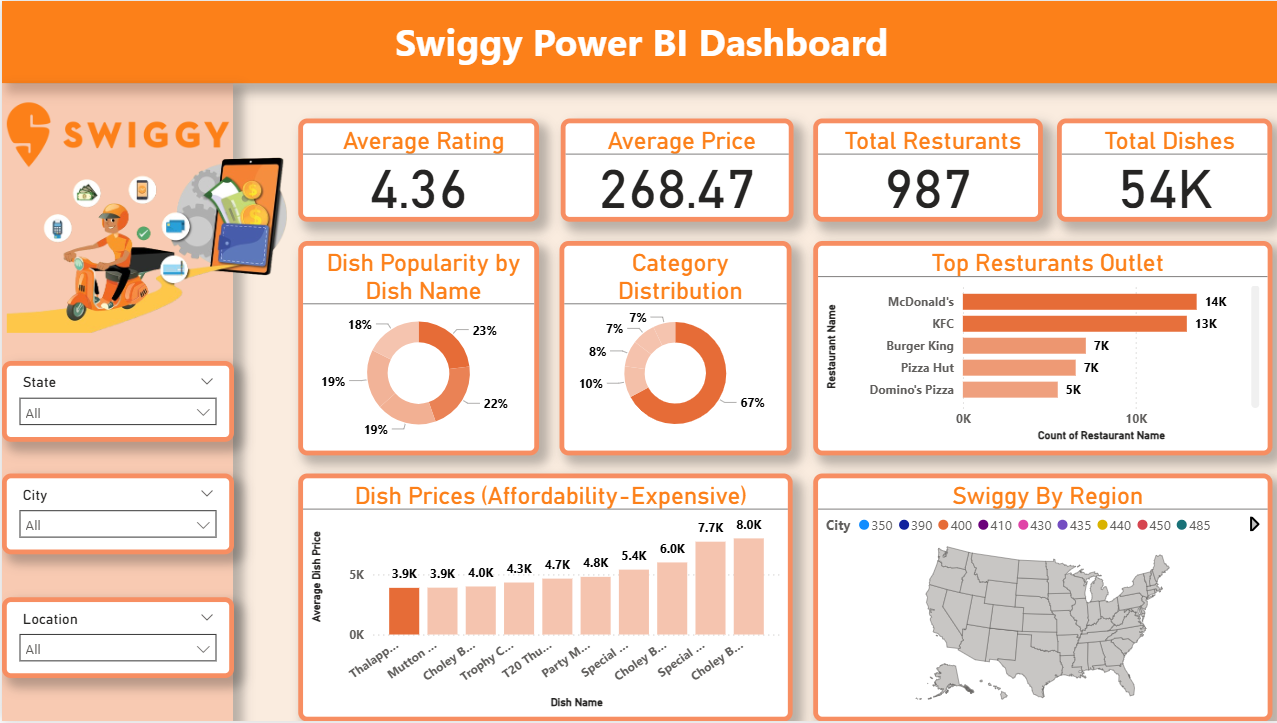
The Food Delivery Analytics Power BI Dashboard Template helps analyze restaurant performance, customer preferences, and pricing trends across locations. This Food Delivery Analytics Power BI Dashboard Template includes key metrics such as average rating, average price, total restaurants, and total dishes to evaluate platform performance effectively. It also highlights dish popularity, category distribution, and top restaurant outlets across different cities. Designed for food delivery platforms, restaurant owners, and business analysts, this Food Delivery Analytics Power BI Dashboard Template helps optimize menu strategies, improve pricing decisions, and identify high-performing locations. It solves challenges related to understanding customer preferences and tracking restaurant performance across regions. The dashboard includes visuals such as dish popularity charts, category distribution graphs, price range analysis, and geographic maps for region-wise insights. Interactive filters allow users to explore data by city, category, and price range for deeper analysis. Download this Food Delivery Analytics Power BI Dashboard Template and start analysing restaurant performance and customer trends today.
Interactive Demo Available
Explore this dashboard live in Power BI
Category
Templates
Chart Types
Bar, Map, Donut
Industry Types
Agriculture & Food, Entertainment & Media
Main Colors
#F78E62
Mode
light
Version
Pro
PBIX File
🔑 Sign in to DownloadBuy this Dashboard