Published
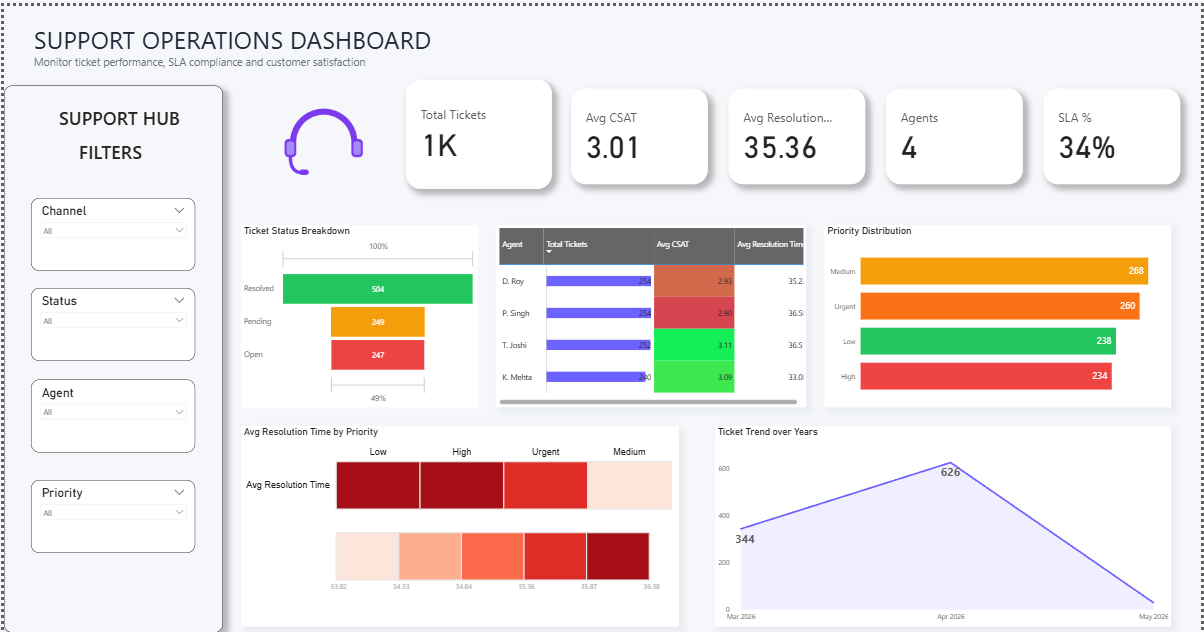
Summary: The Briqlab Support Operations Dashboard is a centralized Power BI solution designed to monitor customer support performance, service efficiency, and SLA compliance. It provides support managers and operations teams with real-time visibility into ticket volumes, resolution effectiveness, customer satisfaction, and agent productivity, enabling faster issue resolution and enhanced customer experiences. Strategic Support Metrics: Real-time tracking of total tickets, customer satisfaction (CSAT), average resolution time, active agents, and SLA compliance rates. Ticket status analysis to monitor open, pending, and resolved cases across support operations. Priority-based ticket distribution for identifying workload allocation and service demand trends. Agent performance monitoring with insights into ticket handling volume, CSAT scores, and resolution efficiency. Resolution time analysis by ticket priority to evaluate operational effectiveness and service responsiveness. SLA performance tracking to ensure adherence to support commitments and identify areas for improvement. Ticket trend analysis over time to monitor support demand, workload fluctuations, and operational performance. Interactive filtering by channel, status, agent, and priority for deeper operational analysis and decision-making. Make It Yours: Customize support KPIs to align with service objectives, operational targets, and customer experience goals. Integrate data from helpdesk platforms, CRM systems, ticketing tools, and customer support applications.
Category
Templates
Chart Types
Bar, Area
Industry Types
Support
Main Colors
Green, Red, Yellow
Mode
light
Version
Pro
PBIX File
🔑 Sign in to DownloadBuy this Dashboard