Published
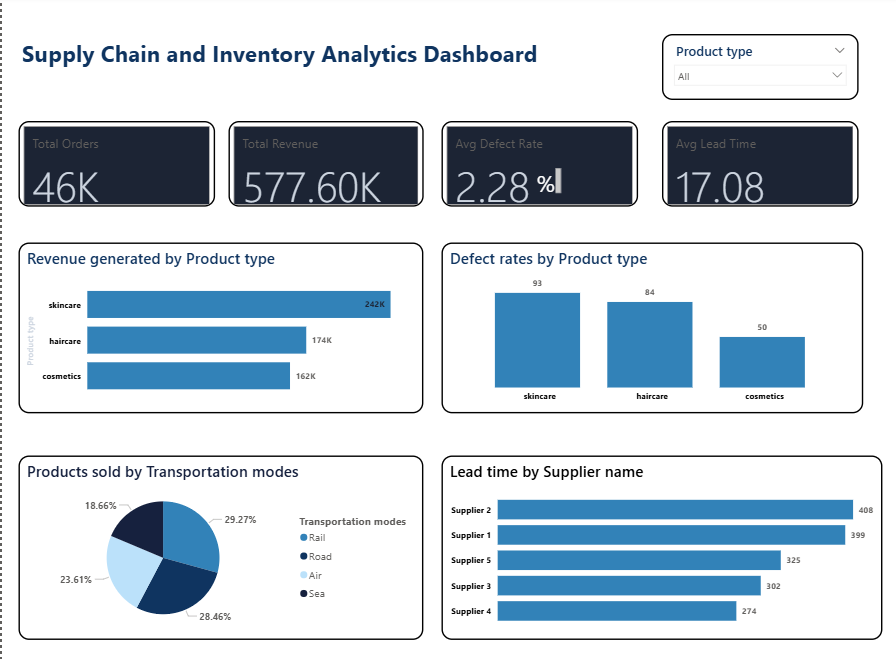
Summary The Briqlab Supply Chain Performance Dashboard is a professional-grade Power BI solution designed to turn complex logistics data into actionable supply chain intelligence. This dashboard provides a 360-degree view of your operations—from procurement to final delivery—enabling organizations to eliminate bottlenecks, reduce waste, and maximize profitability with data-driven precision. Key Supply Chain Metrics Operational Health KPIs: Instant snapshots of total orders, revenue, and average lead times for a real-time assessment of fulfillment speed. Quality & Defect Tracking: Visual monitoring of average defect rates across product lines to uphold brand standards and reduce return costs. Logistics & Mode Optimization: Comprehensive analysis of demand distribution across transportation modes to refine shipping strategies and lower costs. Supplier Performance Benchmarking: Precision tracking of supplier lead times and reliability to identify delays and optimize vendor selection. Revenue Segmentation: Granular breakdown of revenue by product type, allowing for better inventory planning and demand forecasting. Process Inefficiency Identification: Interactive tools to pinpoint logistical delays and production errors before they impact the bottom line. Make it Yours Download this Briqlab template to access the underlying DAX formulas and data architecture. Simply plug in your own ERP data, shipping logs, or inventory files to start optimizing your supply chain operations today.
Category
Templates
Chart Types
Bar, Pie
Industry Types
Finance
Main Colors
Blue
Mode
light
Version
Pro
PBIX File
🔑 Sign in to DownloadBuy this Dashboard