Published
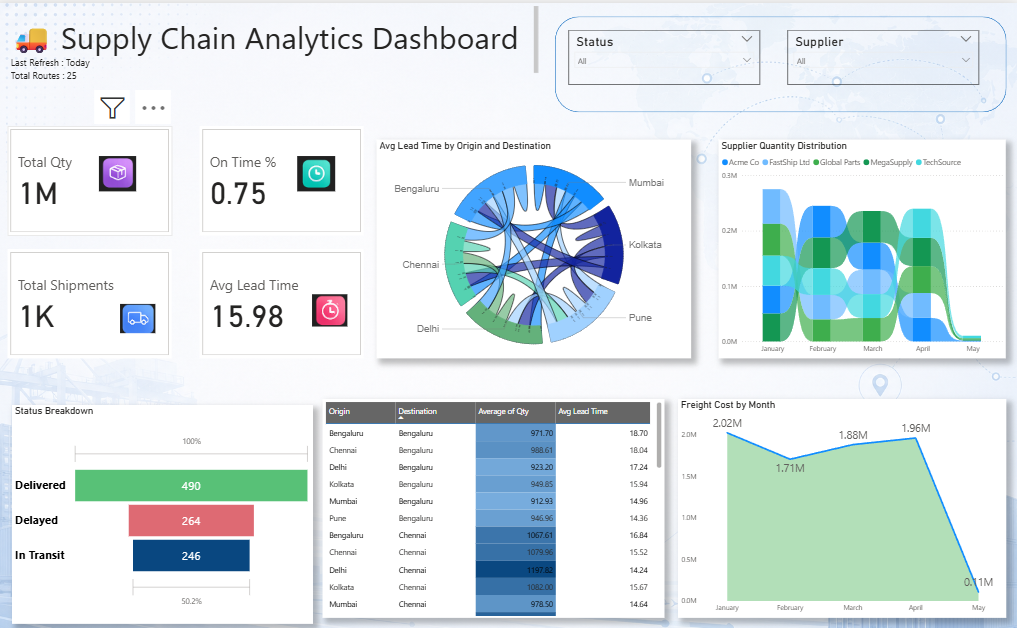
Summary: The Supply Chain Analytics Dashboard is a centralized Power BI solution designed to monitor logistics performance, shipment efficiency, supplier operations, and freight costs across the supply chain network. It provides supply chain managers and operations teams with real-time visibility into inventory movement, transportation performance, lead times, and supplier contributions, enabling data-driven decisions and improved operational efficiency. Strategic Supply Chain Metrics: Real-time tracking of total quantity shipped, total shipments, average lead time, and on-time delivery performance. Shipment status analysis to monitor delivered, delayed, and in-transit orders across the distribution network. Origin-to-destination flow analysis to understand transportation routes and logistics movement patterns. Supplier quantity distribution monitoring to evaluate supplier contributions and procurement dependencies. Lead time analysis by origin and destination locations to identify transportation bottlenecks and efficiency gaps. Freight cost tracking over time to monitor transportation expenses and optimize logistics spending. Regional shipment performance analysis to compare operational efficiency across multiple locations. Interactive filtering by supplier, shipment status, origin, destination, and time period for deeper operational insights. Make It Yours: Customize supply chain KPIs to align with logistics objectives, procurement goals, and operational targets. Integrate data from ERP systems, warehouse management systems (WMS), transportation management systems (TMS), and supplier databases.
Category
Templates
Chart Types
Area
Industry Types
Supply Chain
Main Colors
Blue, Green
Mode
light
Version
Pro
PBIX File
🔑 Sign in to DownloadBuy this Dashboard