Published
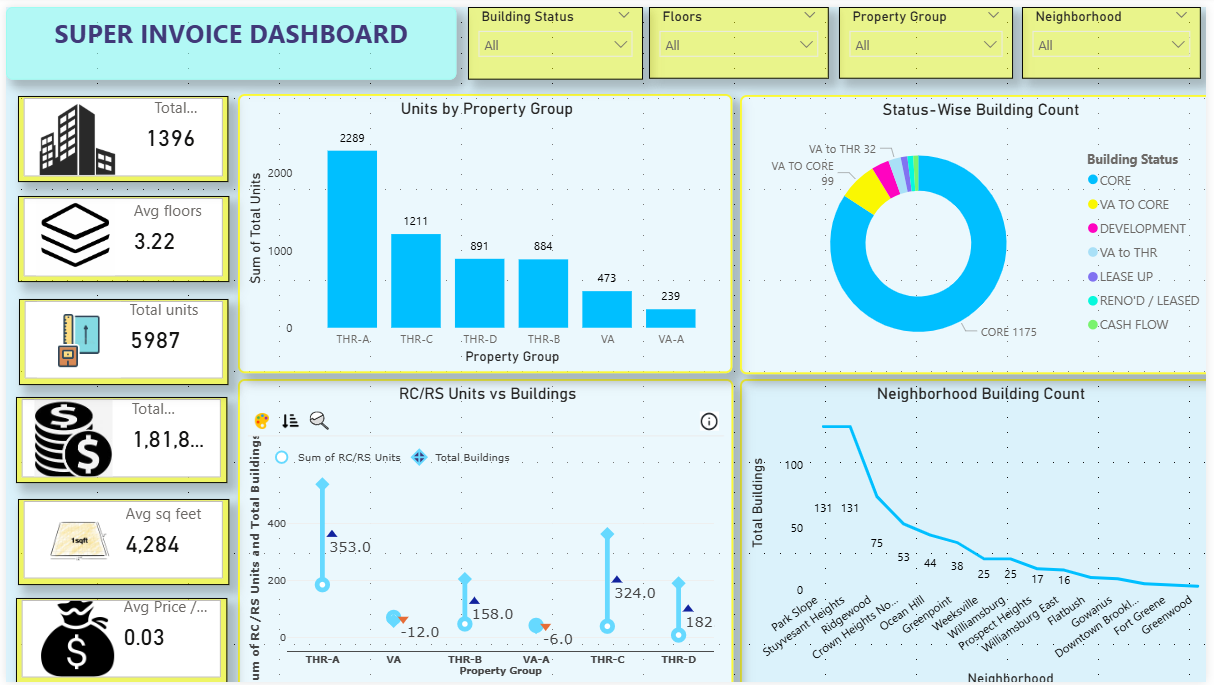
The Real Estate Finance Power BI Dashboard Template helps analyze property portfolio performance, financial metrics, and operational insights across buildings and neighborhoods. This Real Estate Finance Power BI Dashboard Template includes key metrics such as total buildings, total units, average floors, average square feet, and pricing indicators to evaluate portfolio performance effectively. It also highlights unit distribution by property group, building status breakdown, neighborhood comparisons, and RC versus RS unit analysis. Designed for real estate managers, investors, and financial analysts, this Real Estate Finance Power BI Dashboard Template helps monitor property performance, optimize investment strategies, and improve financial planning. It solves challenges related to tracking portfolio metrics and understanding operational trends across properties. The dashboard includes visuals such as property group distribution charts, status-wise building analysis, neighborhood comparison graphs, and KPI cards for quick insights. Interactive filters allow users to explore data by property group, building status, floors, and neighborhood for deeper analysis. Download this Real Estate Finance Power BI Dashboard Template and start analysing property performance and financial trends today.
Interactive Demo Available
Explore this dashboard live in Power BI
Category
Templates
Chart Types
Bar, Area, Donut
Industry Types
Finance, Marketing, Real Estate
Main Colors
Blue
Mode
light
Version
Pro
PBIX File
🔑 Sign in to DownloadBuy this Dashboard