Published
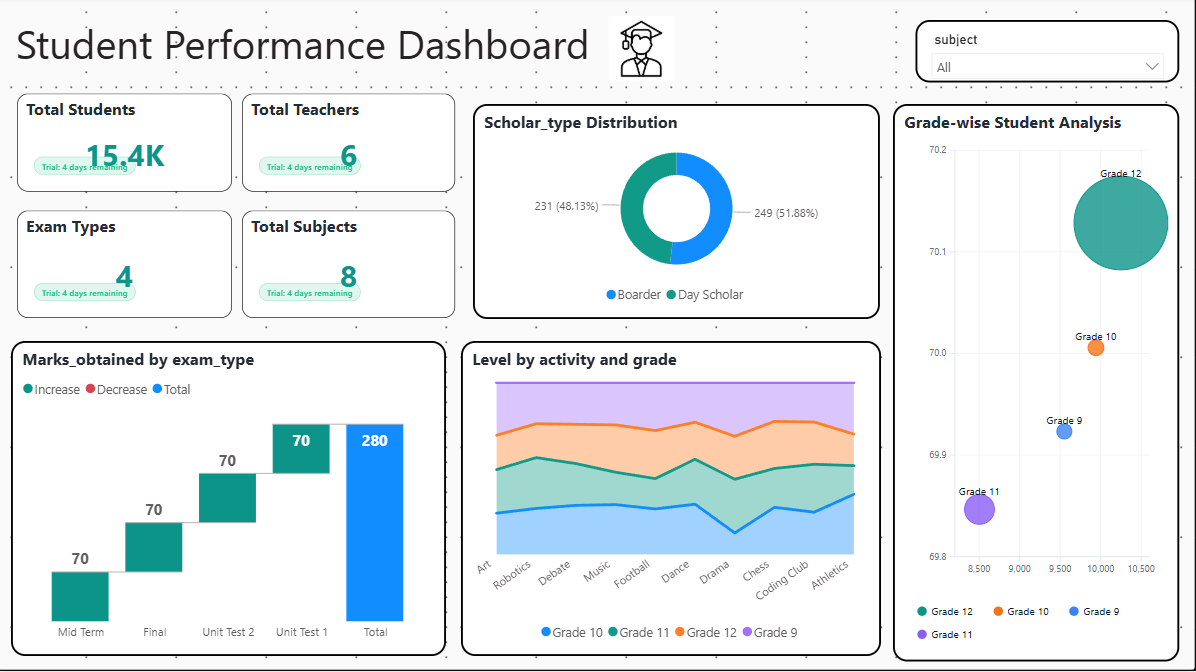
Summary: The Briqlab Student Performance Dashboard is a modern Power BI solution designed to monitor academic performance, student engagement, and institutional efficiency. It delivers a centralized view of student metrics, examination performance, scholar distribution, and grade-wise analysis to support smarter educational planning and data-driven decision-making. Strategic Education Metrics: Real-time tracking of total students, teachers, subjects, and examination types Scholar type distribution analysis between Boarder and Day Scholar students Grade-wise student performance insights with comparative academic analysis Exam performance tracking across Mid Term, Final, and Unit Tests Activity and participation analysis across Robotics, Debate, Music, Football, Dance, Drama, Chess, Coding Club, and Athletics Performance trend visualization to identify strengths, engagement levels, and improvement opportunities among students Make it Yours: Download this Briqlab template to access the complete Power BI model, DAX measures, and visual design architecture. Connect your own school, college, or academic datasets to uncover meaningful insights, improve student outcomes, and build smarter educational strategies today.
Interactive Demo Available
Explore this dashboard live in Power BI
Category
Templates
Chart Types
Area, Donut
Industry Types
Education
Main Colors
Blue, Green
Mode
light
Version
Pro
PBIX File
🔑 Sign in to DownloadBuy this Dashboard