Published
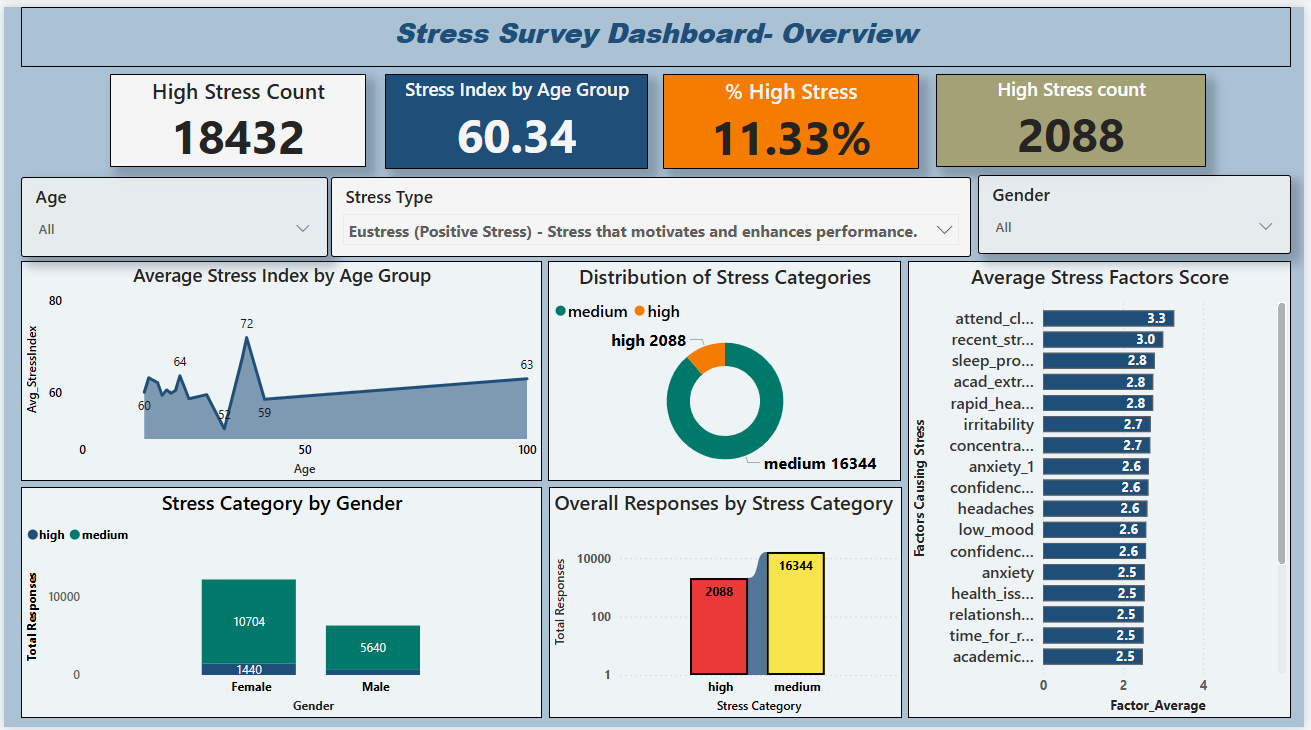
The Mental Health Analytics Power BI Dashboard Template helps analyze stress levels, behavioral patterns, and contributing factors using survey data. This Mental Health Analytics Power BI Dashboard Template includes key metrics such as high stress count, stress index by age group, and percentage of high stress respondents to evaluate well-being trends effectively. It also highlights stress distribution by age, gender, and stress categories along with key contributing factors like sleep patterns, academic pressure, anxiety, and workload. Designed for researchers, HR teams, and wellness program managers, this Mental Health Analytics Power BI Dashboard Template helps identify high-risk groups, monitor stress trends, and support mental health initiatives. It solves challenges related to understanding behavioral data and identifying key stress drivers across demographics. The dashboard includes visuals such as stress index trend charts, category distribution graphs, demographic comparisons, and factor analysis visuals. Interactive filters allow users to explore data by age group, gender, and stress type for deeper insights. Download this Mental Health Analytics Power BI Dashboard Template and start analysing stress patterns and well-being trends today.
Interactive Demo Available
Explore this dashboard live in Power BI
Category
Templates
Chart Types
Bar, Line, Donut
Industry Types
Healthcare
Main Colors
Blue
Mode
light
Version
Pro
PBIX File
🔑 Sign in to DownloadBuy this Dashboard