Published
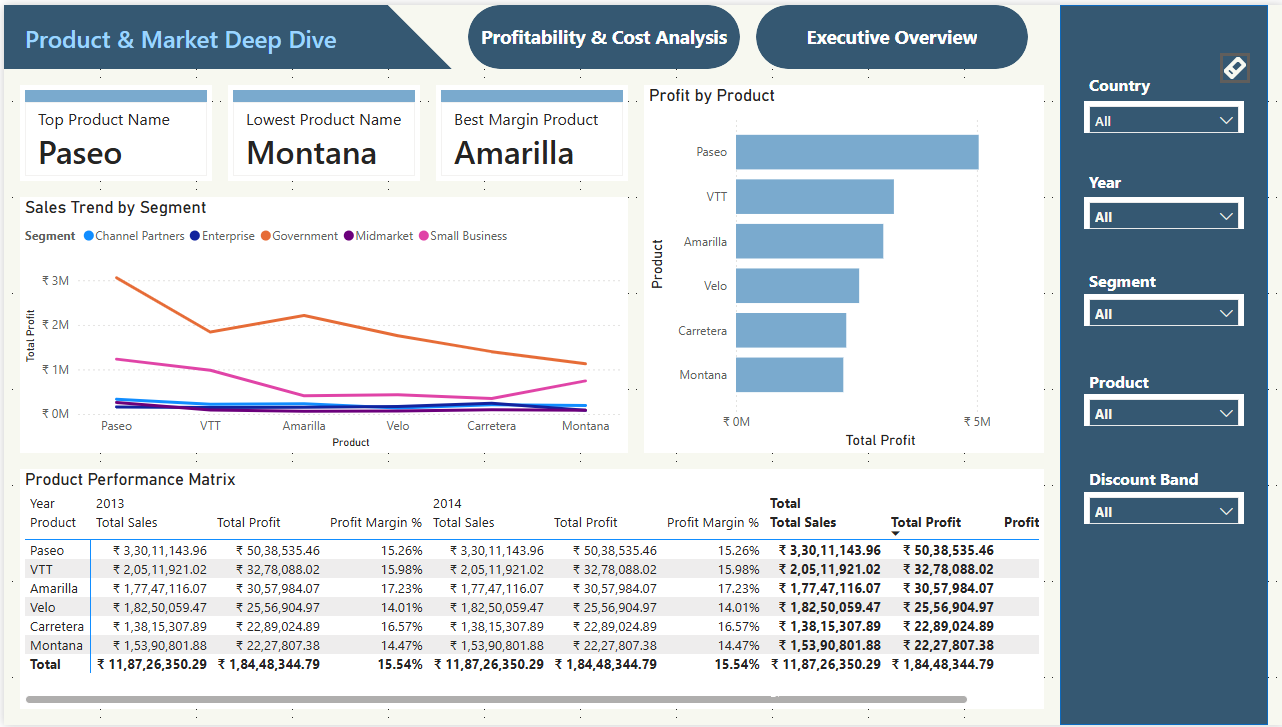
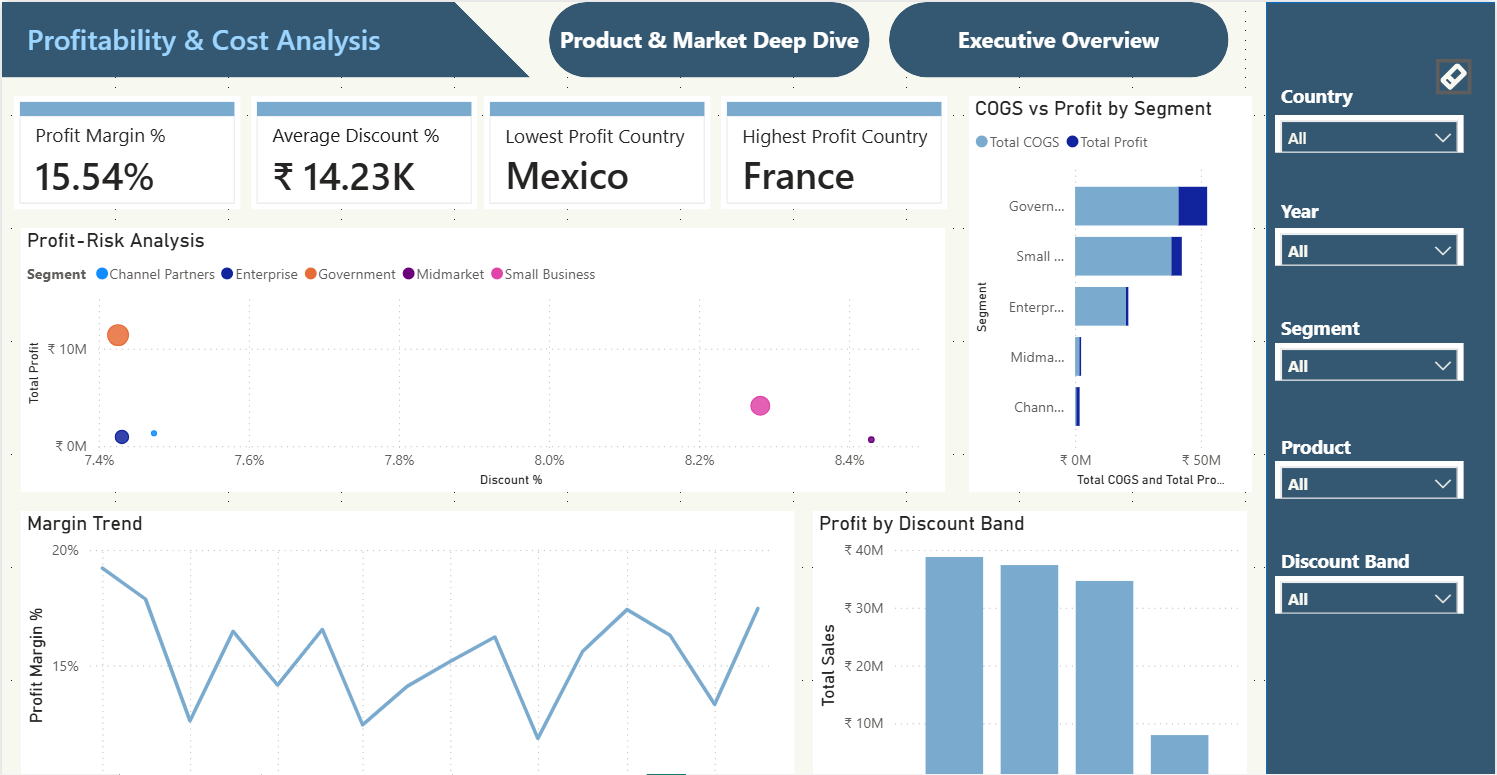
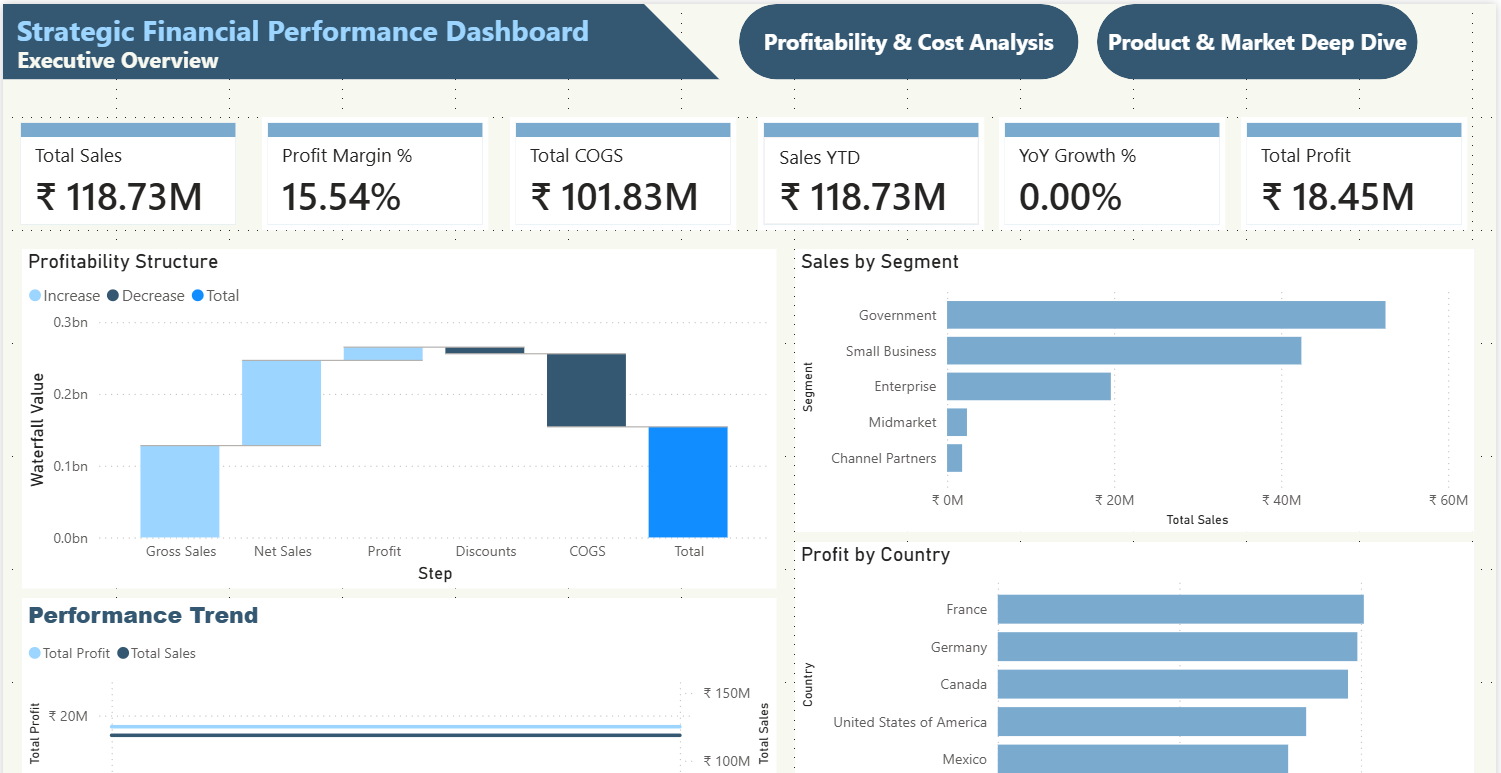
Get a clear, executive-level view of your organisation's financial health with this Strategic Financial Performance Power BI dashboard template, designed to consolidate critical financial KPIs and profitability insights into a single, structured summary for leadership teams. The dashboard tracks all essential financial metrics including total sales, total profit, total COGS, profit margin percentage, sales year-to-date, and year-over-year growth — delivering an instant financial snapshot that supports fast, confident executive decision-making. Additional KPIs cover segment-level revenue contribution, geographic profit performance by country, and time-based sales and profit trend analysis, helping leadership teams monitor financial stability and identify growth patterns across markets and customer segments. This template is designed for CFOs, financial controllers, senior executives, and strategy teams who need a presentation-ready dashboard for board reviews, leadership meetings, and high-level financial performance discussions. Visuals include a profitability structure waterfall chart breaking down gross sales, discounts, COGS and net profit, segment revenue comparison charts, profit by country bar charts, and performance trend line graphs over time — all built natively in Power BI Desktop with no external plugins or tools required. Download this Strategic Financial Performance Power BI dashboard template, open the PBIX file in Power BI Desktop, and start presenting your financial strategy with clarity today.
Interactive Demo Available
Explore this dashboard live in Power BI
Category
Templates
Chart Types
Bar, Line, Scatter Plot
Industry Types
Finance
Main Colors
#355872
Mode
light
Version
Pro
PBIX File
🔑 Sign in to DownloadBuy this Dashboard