Published
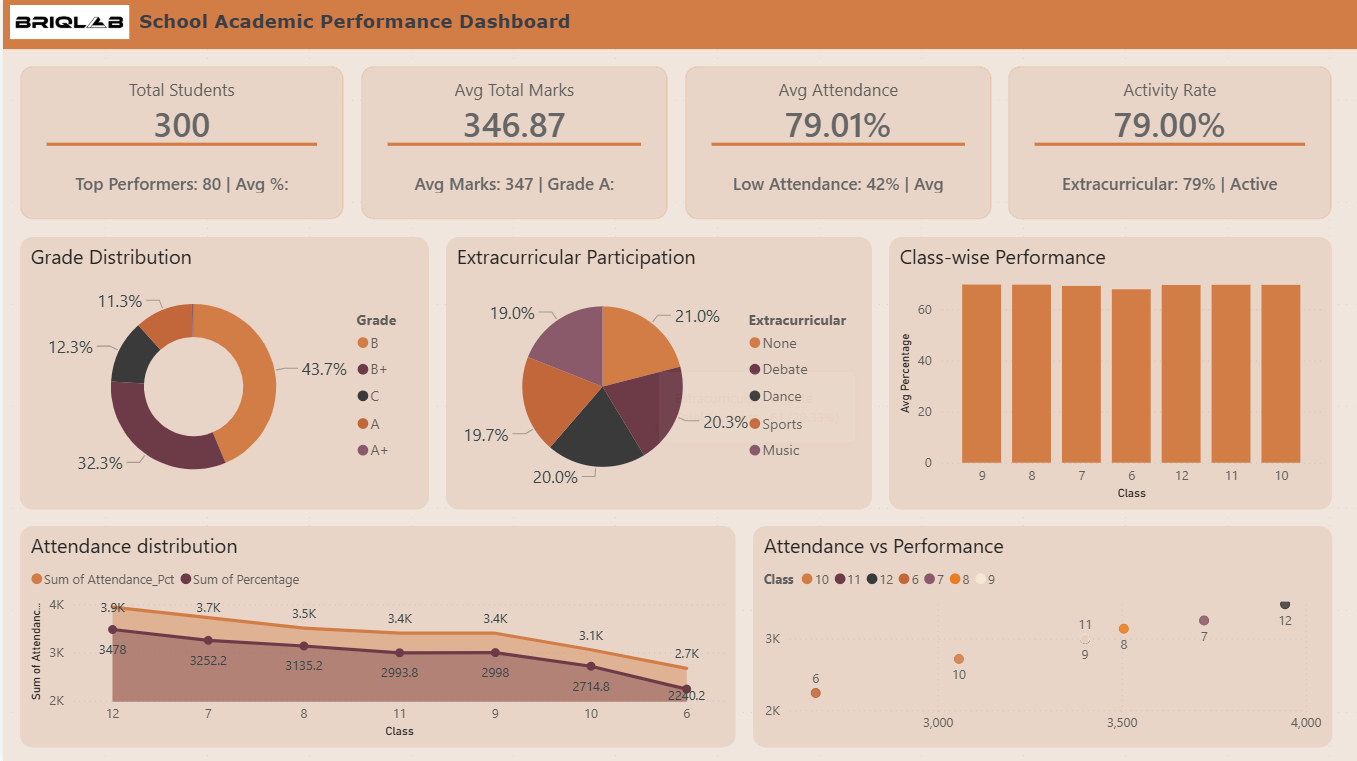
The School Academic Performance Dashboard provides a comprehensive overview of student academic results, attendance trends, and extracurricular engagement across different classes. This dashboard enables school administrators, teachers, and academic coordinators to monitor student performance and identify areas for improvement through data-driven insights. The Grade Distribution visualization provides insights into the proportion of students achieving grades such as A+, A, B+, and C, helping educators assess academic performance levels. The Extracurricular Participation chart highlights student involvement in activities such as debate, sports, music, and dance, reflecting the importance of holistic development. The Class-wise Performance chart compares average academic scores across different classes, while the Attendance Distribution analysis tracks attendance patterns over time. Additionally, the Attendance vs Performance scatter analysis demonstrates the relationship between attendance levels and academic performance
Category
Templates
Chart Types
Bar, Line, Pie, Scatter Plot
Industry Types
Education
Main Colors
#D27D46
Mode
light
Version
Pro
PBIX File
🔑 Sign in to DownloadBuy this Dashboard