Published
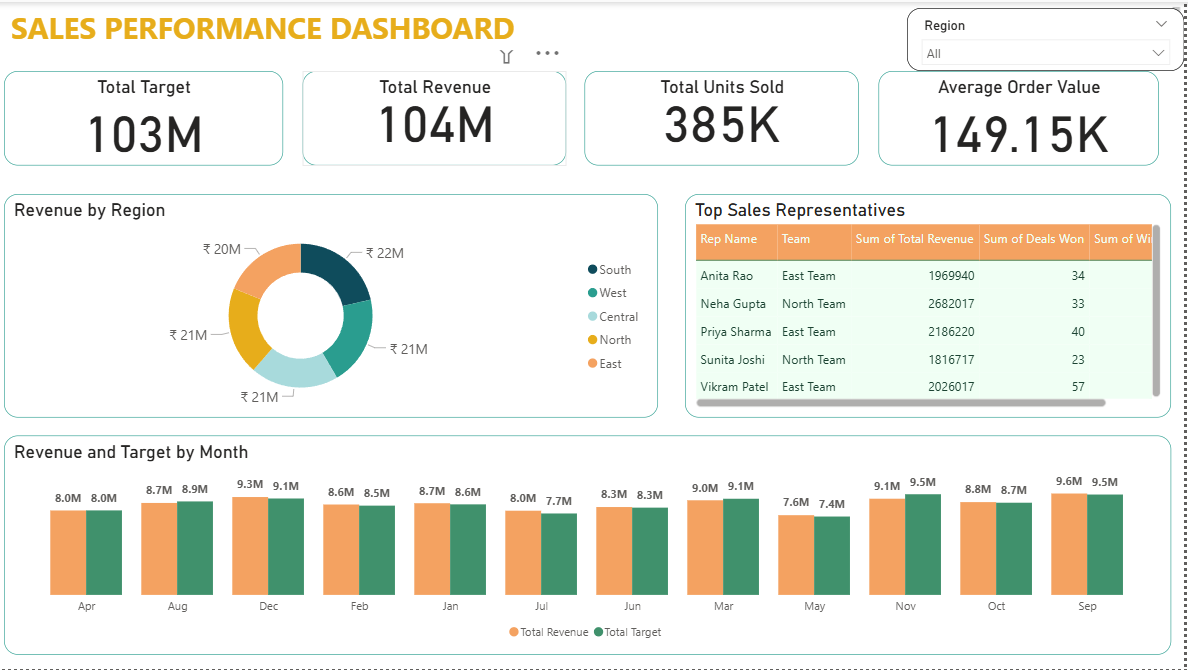
Summary The Briqlab Sales Performance Dashboard is a professional-grade Power BI solution engineered for Sales Directors, Revenue Operations, and Business Leaders who require total visibility into their growth engine. This dashboard transforms fragmented transactional data into actionable sales intelligence, allowing you to monitor target achievement, regional health, and individual rep performance in one unified, high-impact interface. Key Sales Performance Metrics Revenue vs. Target Tracking: Instant snapshots of total sales against set quotas with real-time achievement percentages to keep your team focused on the finish line. Regional Growth Analytics: Comparative performance breakdown across North, South, East, West, and Central regions to identify market leaders and laggards. Product & Margin Intelligence: Granular analysis of sales volume by product category coupled with margin tracking to ensure profitable growth. Sales Rep Leaderboards: Data-driven ranking of team members based on total revenue, conversion win rates, and Average Order Value (AOV). Net Revenue & Returns Monitoring: Integrated tracking of product returns and cancellations to provide a true view of bottom-line net revenue. Time-Series Trend Analysis: Visualizing monthly sales trends and Year-over-Year (YoY) growth to decode seasonal patterns and long-term momentum. Make it Yours Download this Briqlab template to access the underlying DAX formulas and data architecture. Designed for seamless integration with Excel, SQL, or your preferred CRM, you can simply plug in your own dataset to start driving data-backed sales decisions today.
Interactive Demo Available
Explore this dashboard live in Power BI
Category
Templates
Chart Types
Bar, Line, Donut
Industry Types
Finance, Retail, Marketing
Main Colors
Green, Yellow
Mode
light
Version
Pro
PBIX File
🔑 Sign in to DownloadBuy this Dashboard