Published
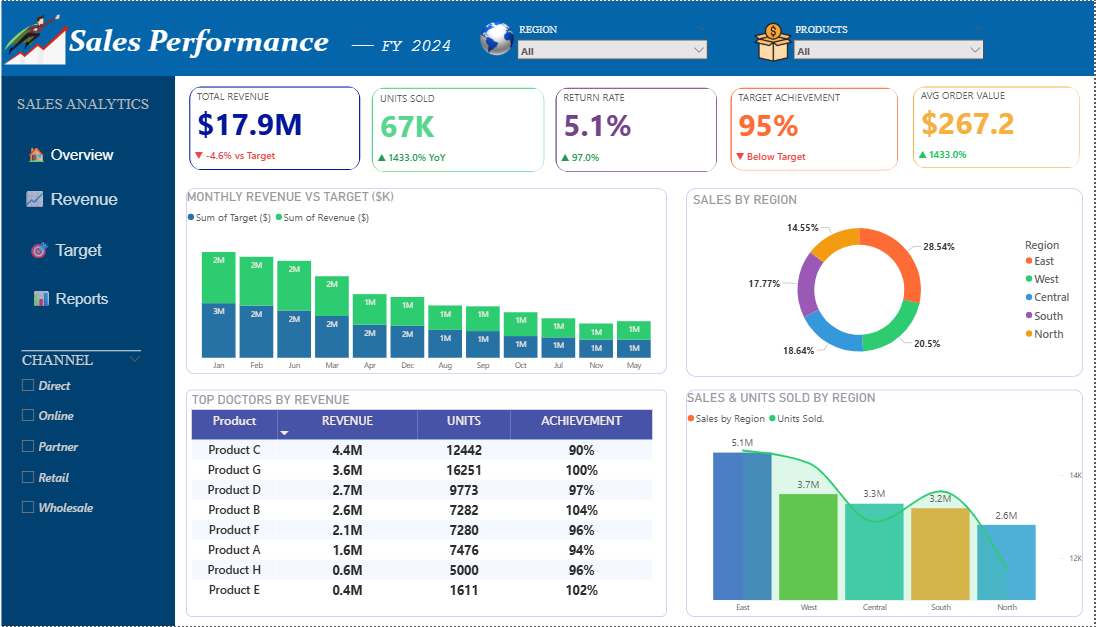
Monitor and improve your sales outcomes with this Sales Performance Power BI dashboard template, built to give sales leaders and business stakeholders a clear, real-time view of revenue health and team performance across regions and product categories. The dashboard tracks all critical sales KPIs including Total Revenue, Units Sold, Return Rate, Target Achievement, and Average Order Value — giving teams an immediate pulse check on overall sales health and operational efficiency. Additional metrics highlight performance gaps against targets, helping sales managers identify underperforming regions, high-return products, and missed revenue opportunities before they compound. This template is designed for sales directors, regional managers, business analysts, and executives who need a fast, reliable way to evaluate sales performance and steer data-driven decisions across markets and product lines. Visuals include revenue trend line charts, target achievement scorecards, return rate indicators, units sold bar charts, and average order value comparisons — all featuring interactive filters for Region and Product to allow dynamic, drill-down exploration of the data. Everything is built natively in Power BI Desktop with no external tools or plugins required. Download this Sales Performance Power BI dashboard template, open the PBIX file in Power BI Desktop, and start tracking your sales KPIs with confidence today.
Interactive Demo Available
Explore this dashboard live in Power BI
Category
Templates
Chart Types
Bar, Line, Donut
Industry Types
Retail, Sales
Main Colors
Blue, Green, #FFFFFF
Mode
light
Version
Pro
PBIX File
🔑 Sign in to DownloadBuy this Dashboard