Published
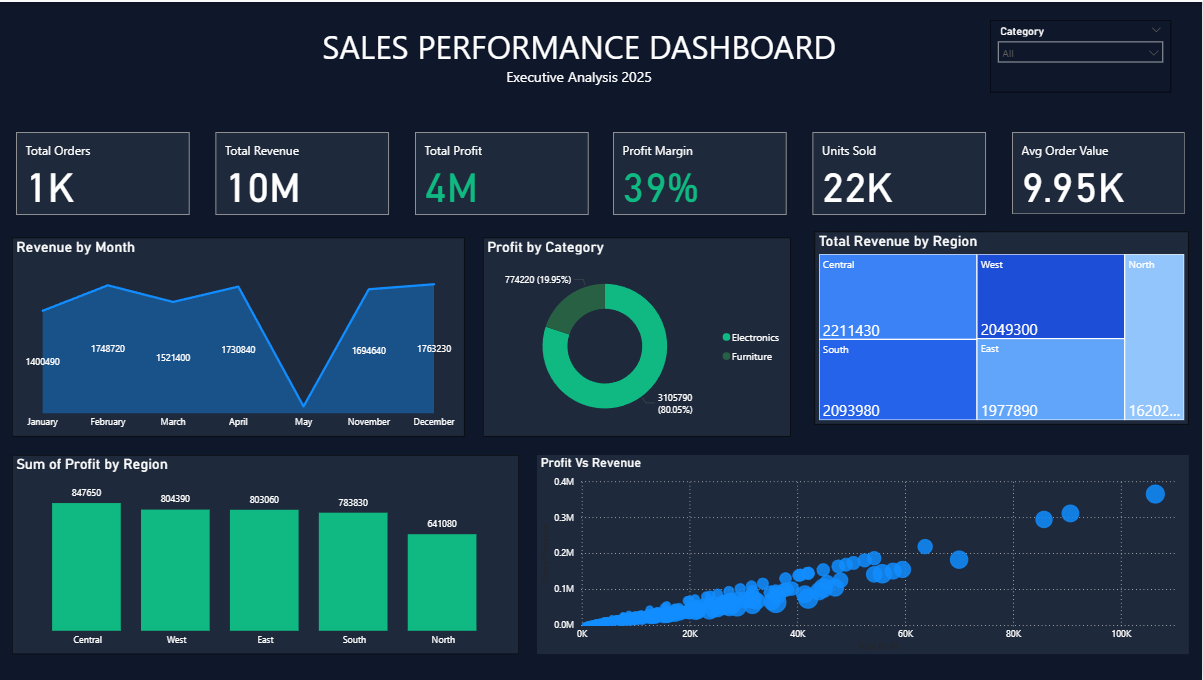
Summary: The Briqlab Sales Performance Dashboard is a powerful Power BI solution designed to provide a comprehensive view of sales operations, revenue generation, and profitability. It enables business leaders and sales teams to monitor key performance indicators, identify growth opportunities, and make data-driven decisions through interactive and visually engaging analytics. Strategic Sales Metrics: Real-time tracking of total orders, revenue, profit, profit margin, units sold, and average order value. Monthly revenue trend analysis to monitor sales performance and identify seasonal patterns. Category-wise profit distribution to evaluate product profitability and optimize portfolio performance. Regional revenue analysis highlighting top-performing sales territories and market contributions. Profit comparison across regions to identify areas driving the highest business value. Revenue vs. profit correlation analysis for understanding product and transaction-level performance. Interactive category filtering for deeper exploration of sales data and business segments. Executive-level insights that support strategic planning, sales forecasting, and performance management. Make It Yours: Customize KPIs to align with your sales targets, business goals, and reporting requirements. Integrate data from ERP systems, CRM platforms, e-commerce stores, and sales databases. Apply company branding, custom themes, and preferred color schemes. Add advanced analytics such as sales forecasting, customer segmentation, product performance tracking, and territory management. Extend the dashboard with drill-through reports, automated alerts, and AI-powered sales insights for enhanced decision-making.
Category
Templates
Chart Types
Bar, Pie, Area, Scatter Plot, Tree Map / Hierarchical Chart
Industry Types
Sales
Main Colors
Blue, Green
Mode
dark
Version
Pro
PBIX File
🔑 Sign in to DownloadBuy this Dashboard