Published
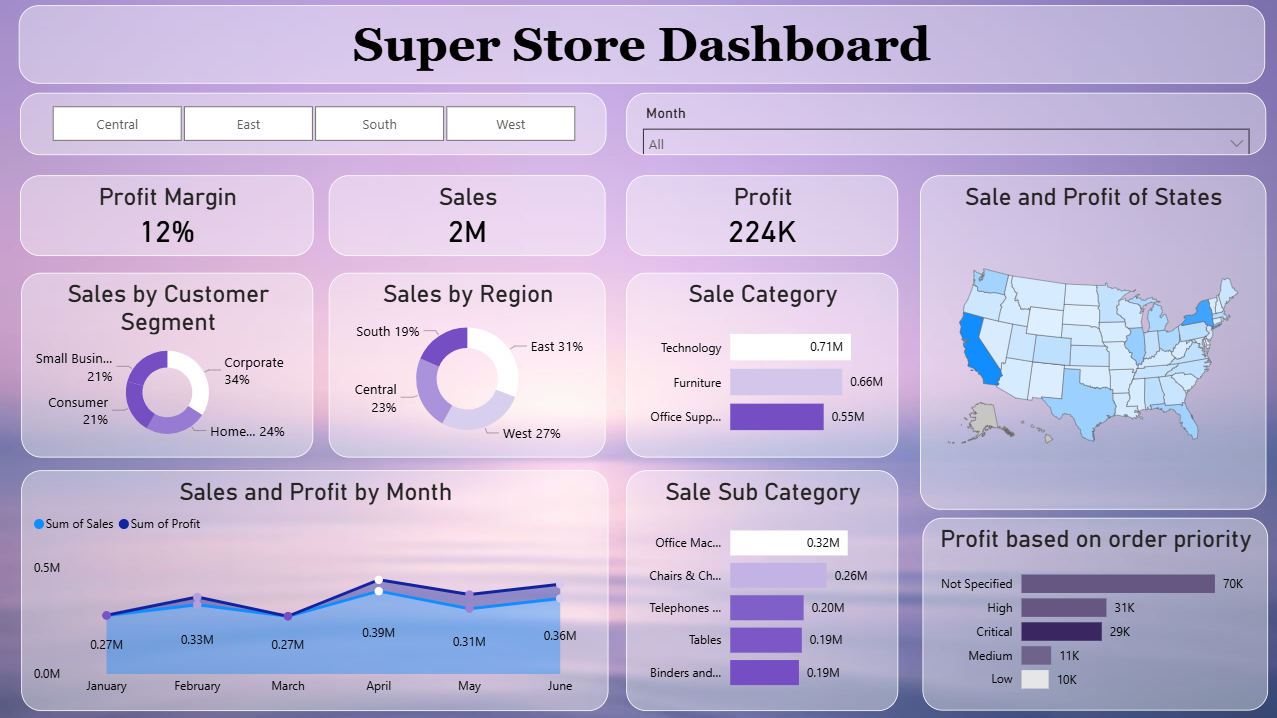
The Retail Sales Power BI Dashboard Template helps track sales performance, profitability, and customer behavior across regions and time periods. This Retail Sales Power BI Dashboard Template includes key metrics such as total sales, total profit, and profit margin to evaluate overall business performance. It also highlights performance by region, customer segment, product category, and sub-category for deeper insights. Designed for retail managers, business analysts, and decision-makers, this Retail Sales Power BI Dashboard Template helps identify high-performing regions, optimize product mix, and improve sales strategies. It solves challenges related to tracking sales trends and understanding customer purchasing behavior. The dashboard includes visuals such as monthly sales and profit trend charts, state-wise sales distribution maps, profit by order priority charts, and KPI cards for quick insights. Interactive filters allow users to explore data by region, segment, category, and time period for detailed analysis. Download this Retail Sales Power BI Dashboard Template and start analysing sales performance and profitability trends today.
Interactive Demo Available
Explore this dashboard live in Power BI
Category
Templates
Chart Types
Bar, Line, Map, Area, Donut
Industry Types
Retail
Main Colors
Blue, #3A2761
Mode
light
Version
Pro
PBIX File
🔑 Sign in to DownloadBuy this Dashboard