Published
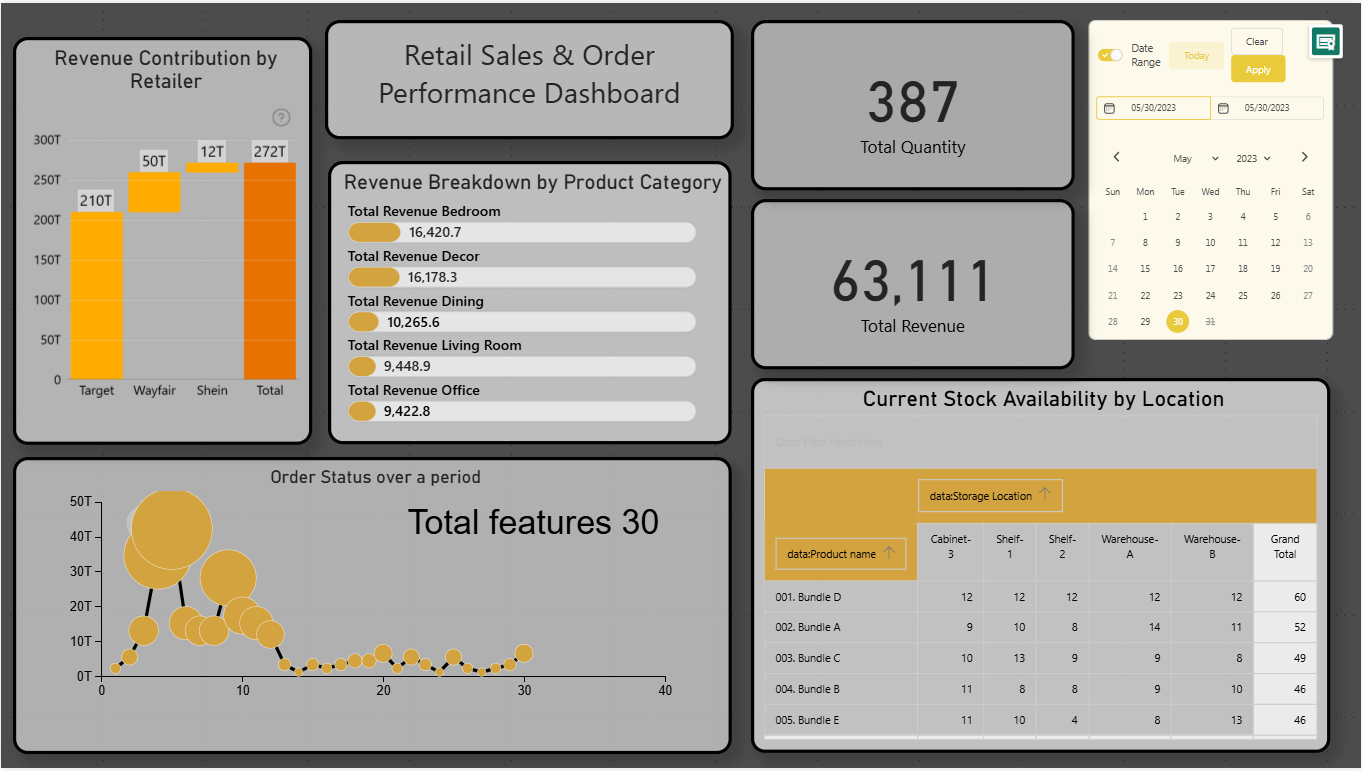
The Retail Order Analytics Power BI Dashboard Template helps track revenue, order performance, and inventory availability across multiple retailers and locations. This Retail Order Analytics Power BI Dashboard Template includes key metrics such as total revenue, total quantity sold, and revenue contribution by retailer to evaluate sales performance effectively. It also highlights product category revenue, order status trends, and stock availability across storage locations. Designed for retail managers, supply chain teams, and business analysts, this Retail Order Analytics Power BI Dashboard Template helps identify demand patterns, optimize inventory management, and improve sales strategies. It solves challenges related to tracking order trends and maintaining inventory visibility across locations. The dashboard includes visuals such as retailer revenue comparison charts, category-level revenue analysis, order trend graphs, and inventory availability visuals. Interactive date range filters allow users to explore time-based insights and analyze performance across different periods. Download this Retail Order Analytics Power BI Dashboard Template and start analysing sales, orders, and inventory performance today.
Interactive Demo Available
Explore this dashboard live in Power BI
Category
Templates
Chart Types
Line
Industry Types
Retail, Marketing
Main Colors
#4C4C4C
Mode
dark
Version
Pro
PBIX File
🔑 Sign in to DownloadBuy this Dashboard