Published
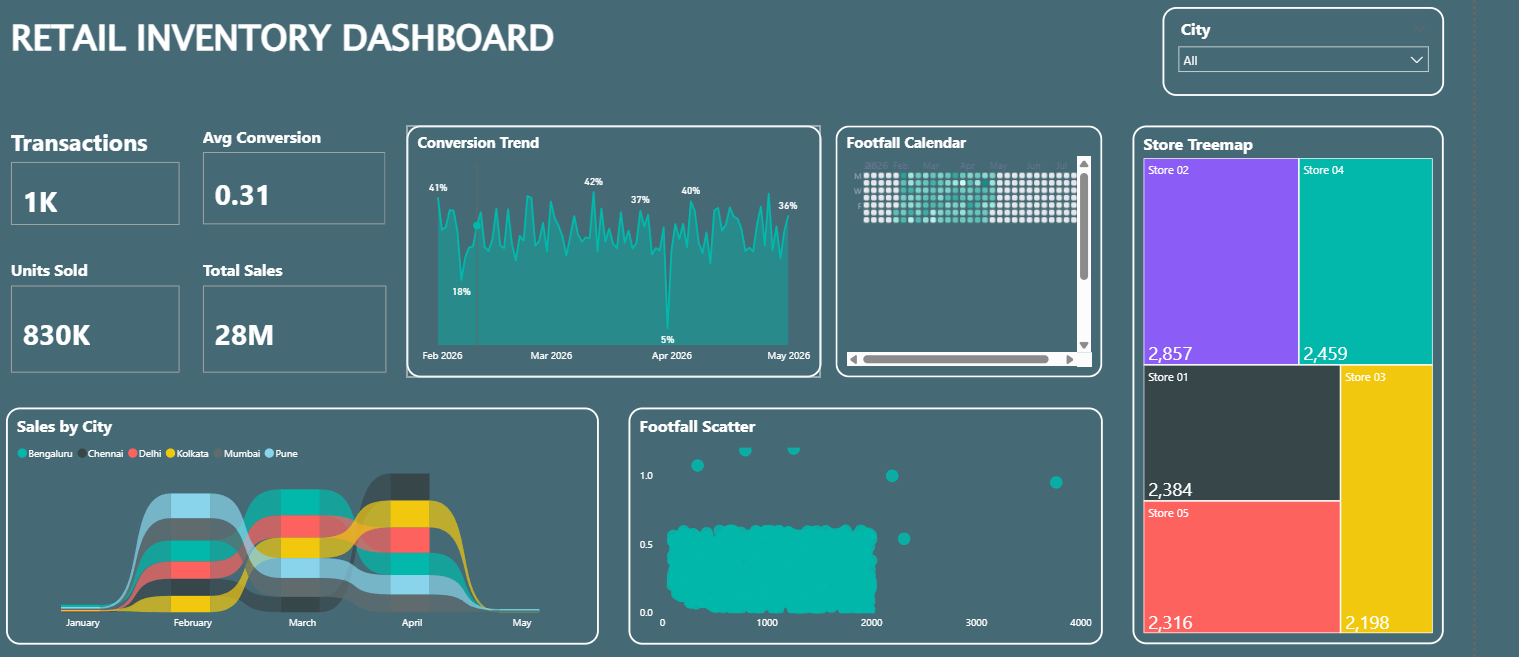
Summary: The Retail Inventory Dashboard is a centralized Power BI solution designed to monitor retail sales performance, inventory utilization, customer traffic, and store-level operations in real time. It provides retail managers and business stakeholders with actionable insights into sales trends, customer conversion efficiency, store performance, and inventory movement, enabling data-driven decisions and optimized retail operations. Strategic Retail Metrics: Real-time tracking of total sales, transactions, units sold, customer footfall, and average conversion rate. Store-wise performance analysis to evaluate sales contribution and identify top-performing retail locations. Customer footfall monitoring to understand traffic patterns and support staffing and inventory planning. Conversion trend analysis to measure sales effectiveness and evaluate customer-to-purchase conversion performance. City-wise sales distribution analysis to identify regional demand patterns and growth opportunities. Footfall versus conversion analysis to assess store efficiency and customer engagement levels. Store performance comparison through treemap visualization to identify high-performing and underperforming stores. Interactive filtering by city and store to enable deeper operational analysis and performance monitoring. Make It Yours: Integrate data from POS systems, retail management platforms, inventory databases, ERP systems, and customer analytics solutions.
Category
Templates
Chart Types
Area, Scatter Plot
Industry Types
Retail
Main Colors
Green
Mode
dark
Version
Pro
PBIX File
🔑 Sign in to DownloadBuy this Dashboard