Published
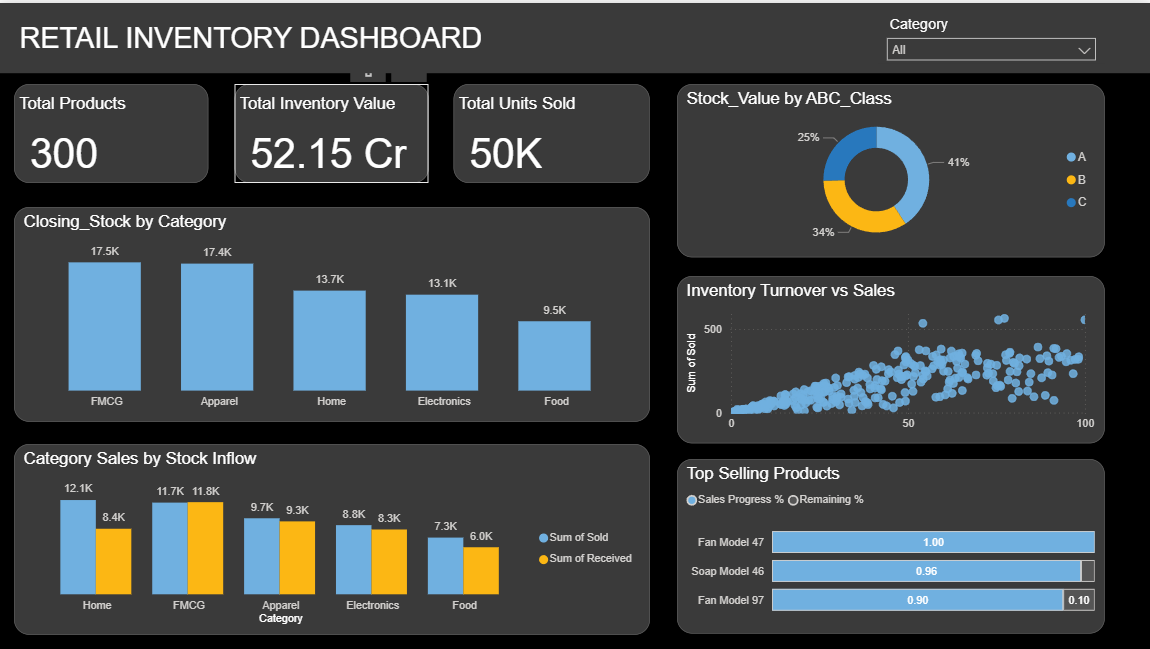
Summary The Briqlab Retail Inventory Dashboard is a professional-grade Power BI solution engineered for Retail Analysts, Store Managers, and Supply Chain professionals who require total visibility into stock health. This dashboard transforms fragmented inventory records into actionable retail intelligence, enabling you to balance stock levels, minimize capital tie-up, and maximize fulfillment efficiency in one unified interface. Key Inventory Performance Metrics Inventory Vital Signs: Instant snapshots of Total Products, Total Inventory Value, and Units Sold to monitor the overall scale and health of your stock. ABC Inventory Classification: Automated segmentation of products into high, medium, and low-value categories to prioritize procurement and storage efforts. Stock Inflow vs. Sales Velocity: Data-driven comparison of category-level sales against incoming inventory to identify potential overstock or stockout risks. Turnover Efficiency Analysis: Visual correlation between inventory turnover rates and sales performance to evaluate how effectively capital is being utilized. Product Performance Progress: High-impact progress charts visualizing your top-selling items to ensure high-demand SKUs remain consistently available. Closing Stock Status: Real-time tracking of current stock levels across all product categories for precise end-of-period reporting and replenishment planning. Make it Yours Download this Briqlab template to access the underlying DAX formulas and data architecture. Designed for seamless integration with Retail POS systems, E-commerce platforms, or Excel, you can simply plug in your own product data to start optimizing your retail operations today.
Interactive Demo Available
Explore this dashboard live in Power BI
Category
Templates
Chart Types
Bar, Scatter Plot, Donut
Industry Types
Retail, Marketing
Main Colors
Blue, Yellow
Mode
dark
Version
Pro
PBIX File
🔑 Sign in to DownloadBuy this Dashboard