Published
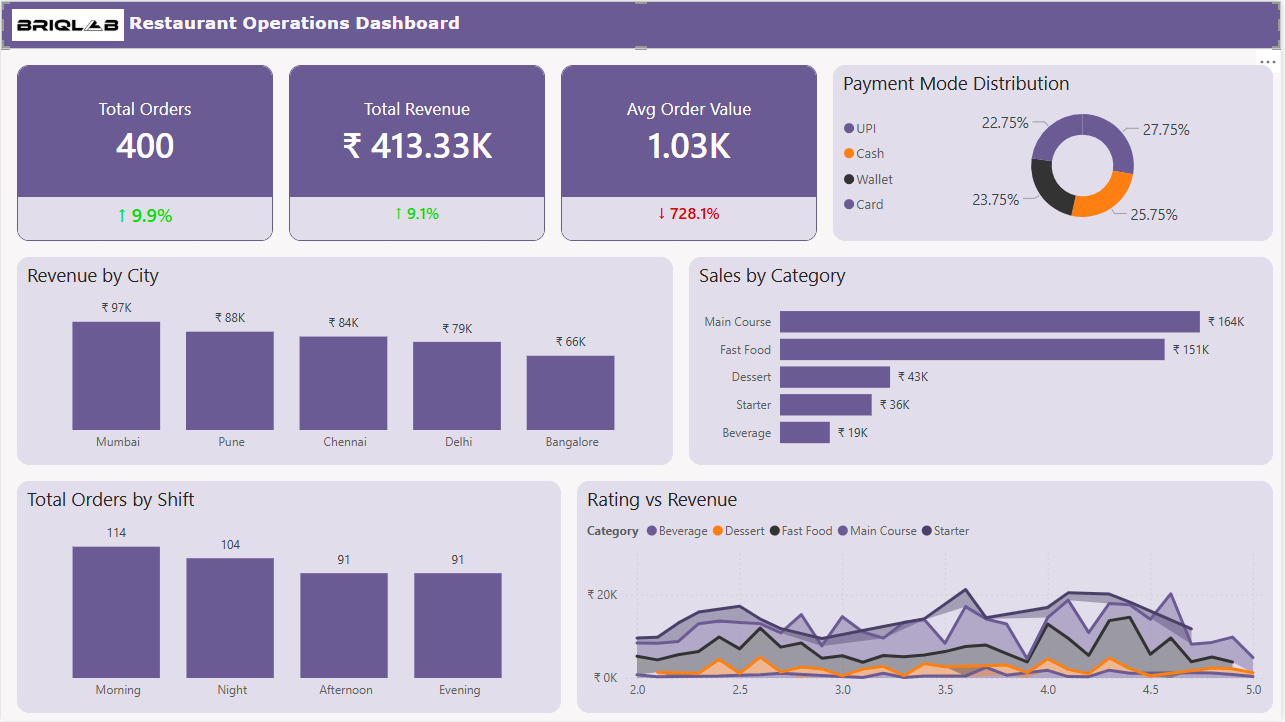
The Restaurant Operations Dashboard provides a centralized analytical view of restaurant sales, customer orders, and revenue performance across different cities, categories, and shifts. This dashboard helps restaurant managers and business owners monitor operational performance, understand customer purchasing patterns, and identify key revenue drivers. The dashboard solves common operational challenges such as tracking total orders, revenue growth, and average order value, while also providing insights into sales performance by food category and city. Managers can quickly identify which menu items generate the most revenue, allowing them to optimize menu offerings and pricing strategies. This dashboard is designed for restaurant owners, operations managers, and business analysts who need data-driven insights to improve sales, optimize operations, and enhance overall customer experience.
Category
Templates
Chart Types
Bar, Area, Donut
Industry Types
Agriculture & Food
Main Colors
#6B5B94
Mode
light
Version
Pro
PBIX File
🔑 Sign in to DownloadBuy this Dashboard