Published
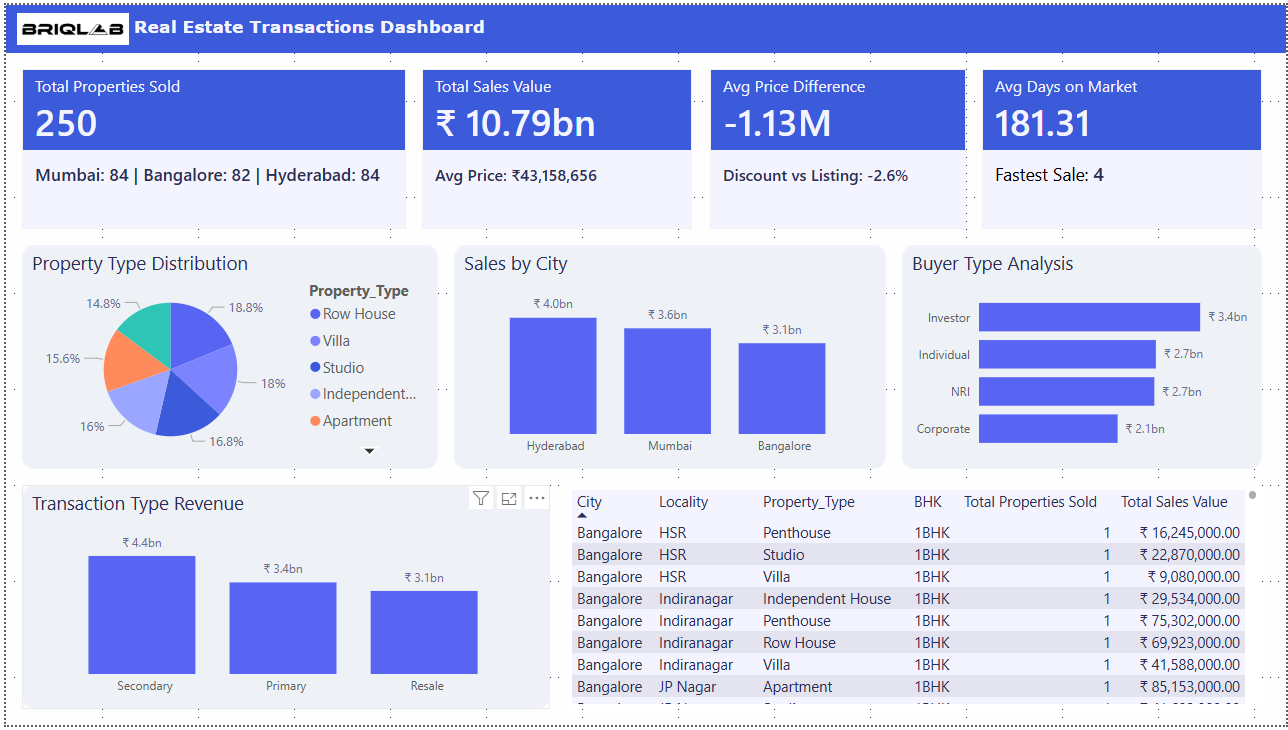
The Real Estate Transactions Dashboard provides a comprehensive overview of property sales performance, transaction trends, and buyer behavior across different cities and property types. It helps real estate professionals analyze market activity and make informed investment and sales decisions. The dashboard solves key challenges such as tracking total properties sold, total sales value, pricing differences between listing and selling price, and the average time properties remain on the market. These insights help stakeholders understand market demand and evaluate property pricing strategies. This dashboard is designed for real estate developers, property investors, sales managers, and market analysts who need data-driven insights to monitor market performance, evaluate investment opportunities, and optimize property sales strategies
Category
Templates
Chart Types
Bar, Pie
Industry Types
Real Estate
Main Colors
Blue, #3B5BDB
Mode
light
Version
Pro
PBIX File
🔑 Sign in to DownloadBuy this Dashboard