Published
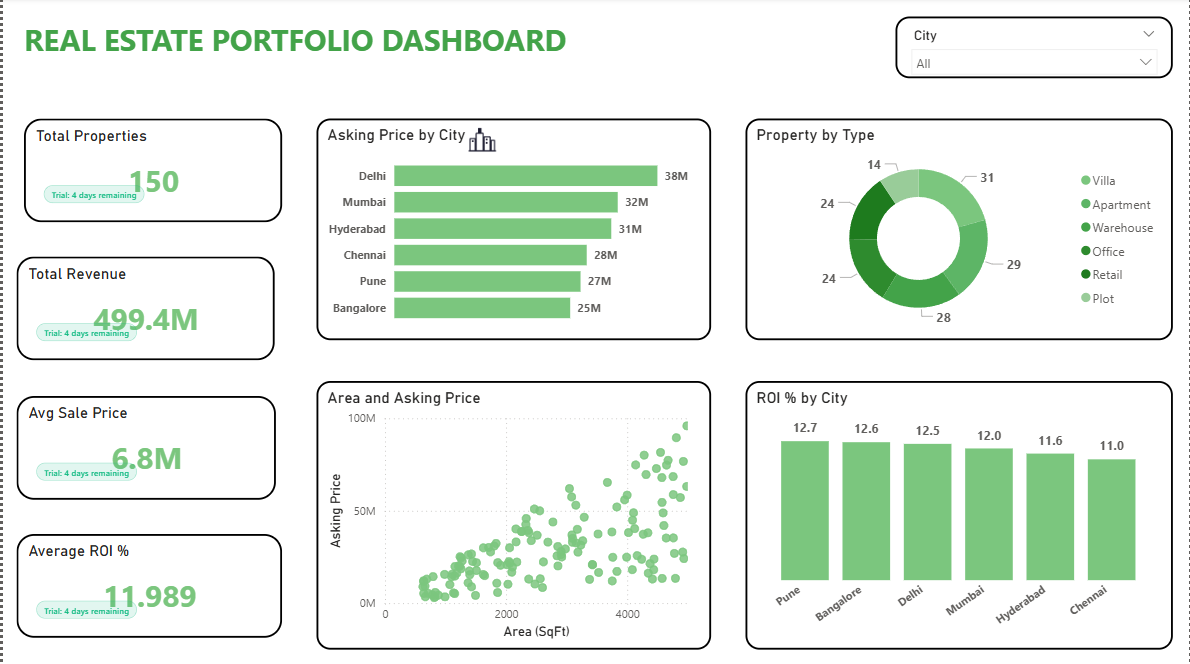
The Briqlab Real Estate Portfolio & Sales Analytics Dashboard is a professional-grade Power BI solution engineered for Developers, Property Managers, and Sales Directors who require total visibility into their property holdings. This dashboard transforms disparate listing data into actionable real estate intelligence, enabling teams to monitor sales velocity, agent productivity, and market price fluctuations in one unified, interactive interface. Key Real Estate Performance Metrics Portfolio Health KPIs: Instant snapshots of total listings—categorized by Villa, Apartment, Retail, and Office—with clear status tracking of available vs. sold inventory. Market Velocity Analysis: Precision monitoring of Average Days on Market by city and property type to identify high-demand zones and slow-moving assets. Pricing Strategy Analytics: Data-driven comparison of listing price vs. market value vs. asking price, including granular price per square foot trends. Agent Productivity Scorecards: Comprehensive tracking of agent conversion rates, total commission earned, and revenue generated per individual. Sales Conversion Funnel: A high-impact visual breakdown of the customer journey, from initial enquiry to final booking. Strategic ROI Benchmarking: Detailed analysis of return on investment (ROI) by location and property type to guide future development and investment decisions. Make it Yours Download this Briqlab template to access the underlying DAX formulas and data architecture. Designed for seamless integration with CRM exports, MagicBricks, or NoBroker data, you can simply plug in your own property records to start optimizing your real estate sales strategy today.
Interactive Demo Available
Explore this dashboard live in Power BI
Category
Templates
Chart Types
Bar, Scatter Plot, Donut
Industry Types
Marketing, Real Estate
Main Colors
Green
Mode
light
Version
Pro
PBIX File
🔑 Sign in to DownloadBuy this Dashboard