Published
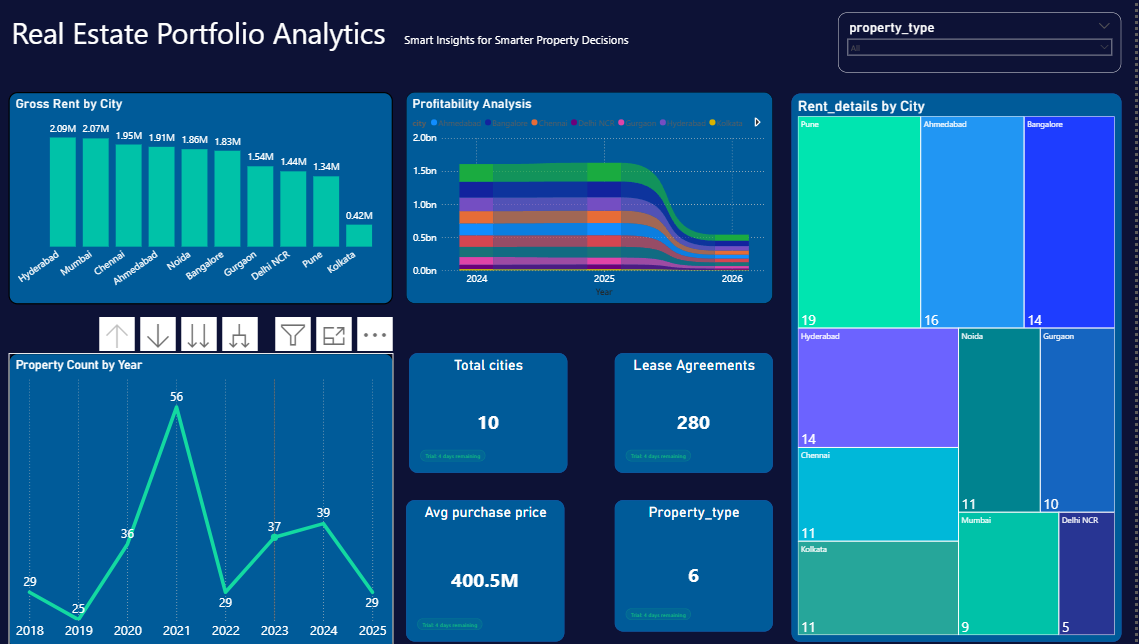
Summary: The Briqlab Real Estate Portfolio Analytics Dashboard is a modern Power BI solution built to transform property and rental data into actionable business insights. Designed with an interactive dark-themed interface, the dashboard provides a complete overview of rental performance, profitability trends, portfolio growth, and city-wise property distribution. It helps real estate investors and property managers make smarter, data-driven decisions through visually engaging analytics and KPI monitoring. Key Features: Track Gross Rent by City and identify top-performing markets Analyze profitability trends across multiple cities Monitor yearly property growth and lease performance Explore city-wise property distribution using interactive treemaps View important KPIs like total cities, lease agreements, average purchase price, and property types Use dynamic filters and interactive visuals for deeper portfolio analysis Make it Yours: Download this Briqlab dashboard template to access the complete Power BI framework, calculated measures, and interactive visual setup. Simply connect your own real estate or rental datasets to create a powerful property analytics experience tailored to your business.
Interactive Demo Available
Explore this dashboard live in Power BI
Category
Templates
Chart Types
Bar, Line, Tree Map / Hierarchical Chart
Industry Types
Real Estate
Main Colors
Blue, Green
Mode
dark
Version
Pro
PBIX File
🔑 Sign in to DownloadBuy this Dashboard