Published
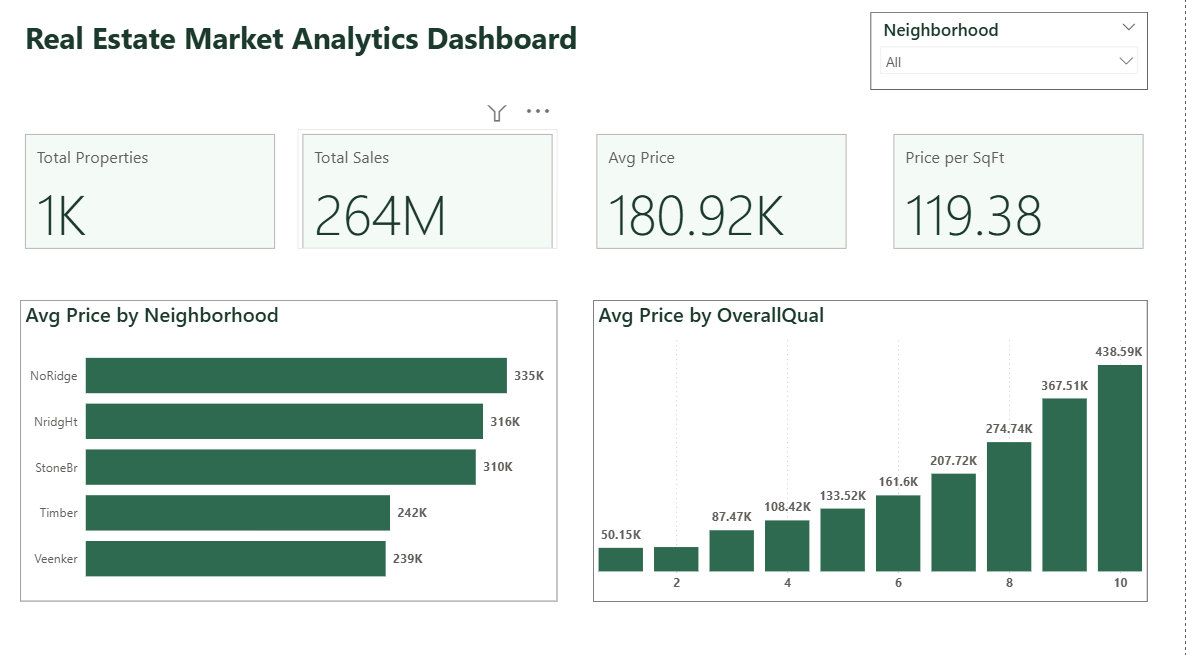
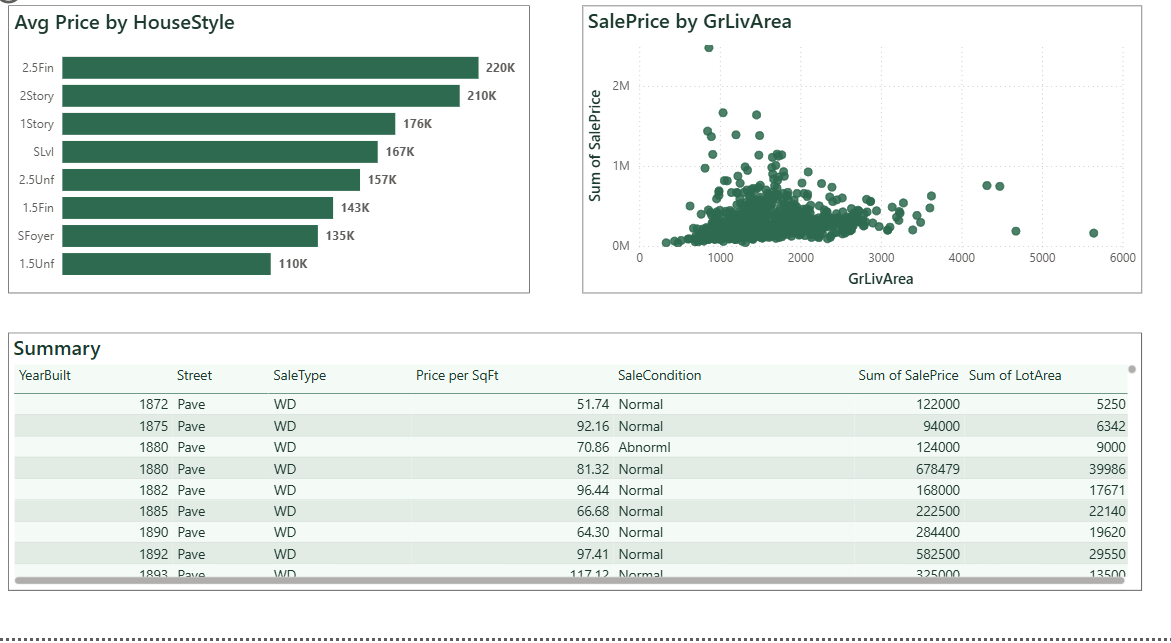
Summary: The Briqlab Real Estate Market Analytics Dashboard is a professional-grade Power BI solution designed to turn complex property data into actionable real estate intelligence. This dashboard provides a comprehensive view of market performance, combining financial KPIs with property characteristics to help investors and agents make high-stakes decisions with confidence. Key Market Performance Metrics: Core Market KPIs: Instant snapshots of total sales value, average property price, and price per square foot for an immediate market health check. Geographic Price Analysis: Dynamic neighborhood filtering to pinpoint high-value zones and compare location-based pricing premiums. Quality-to-Value Mapping: Visual correlation between construction quality and sale price, highlighting the premium commanded by superior design. Property Style Insights: Comparative breakdown of house styles to identify buyer preferences and architectural value. Living Area Correlation: Scatter plot analysis of square footage versus sale price to identify market outliers and undervalued opportunities. Granular Transaction Logs: Detailed drill-through tables covering year built, street type, and sale conditions for deep-dive record analysis. Make it Yours: Download this Briqlab template to access the underlying DAX formulas and data architecture. Simply plug in your own real estate API data or local MLS exports to start optimizing your property investment strategy today.
Interactive Demo Available
Explore this dashboard live in Power BI
Category
Templates
Chart Types
Bar, Scatter Plot
Industry Types
Real Estate
Main Colors
Green
Mode
light
Version
Pro
PBIX File
🔑 Sign in to DownloadBuy this Dashboard