Published
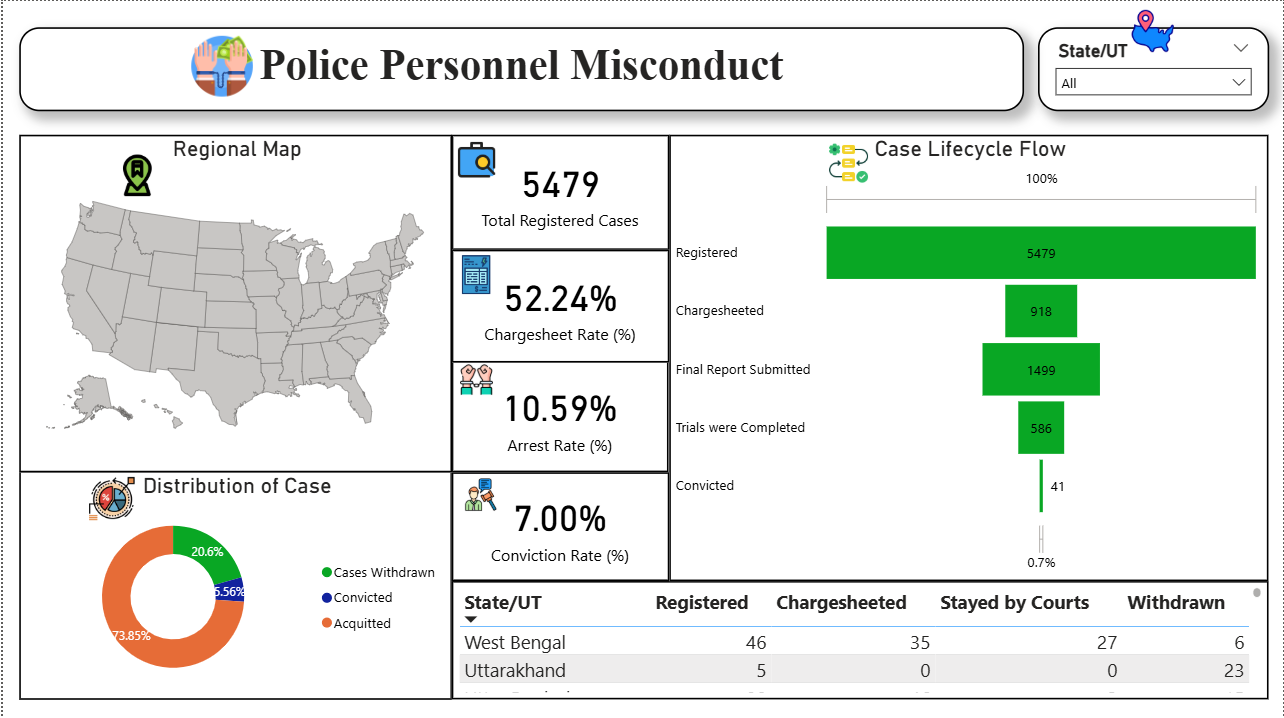
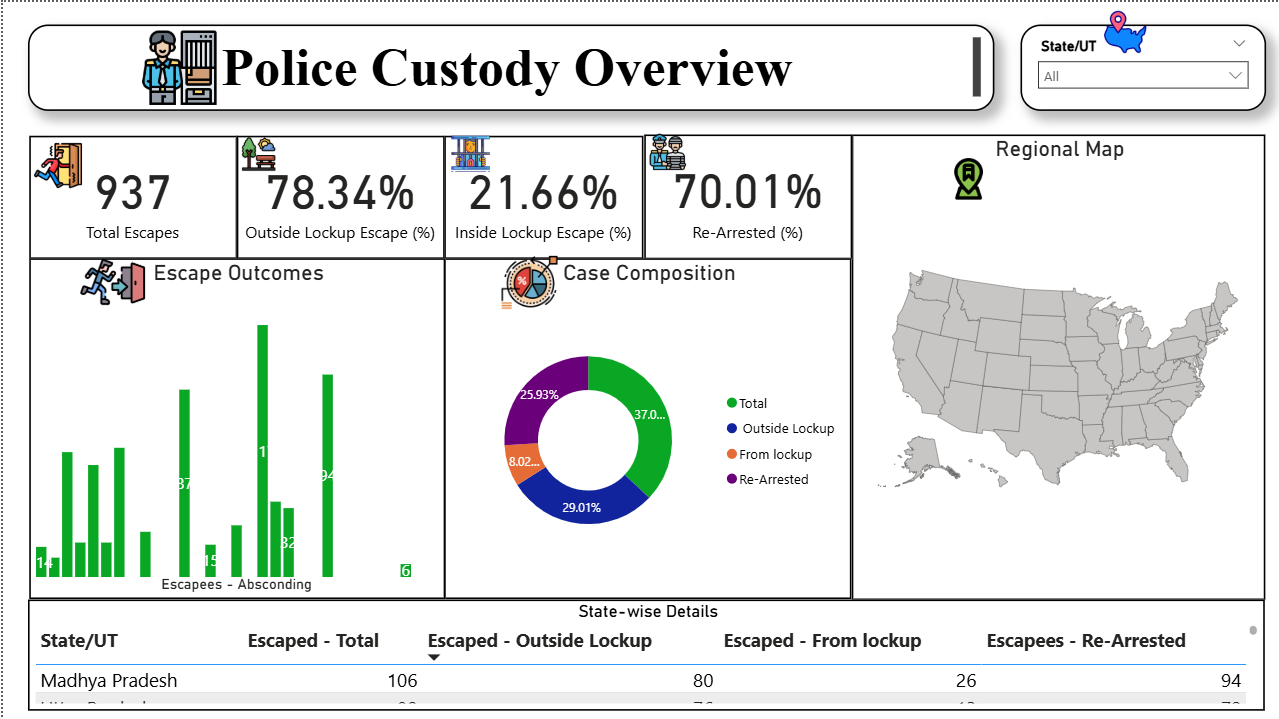
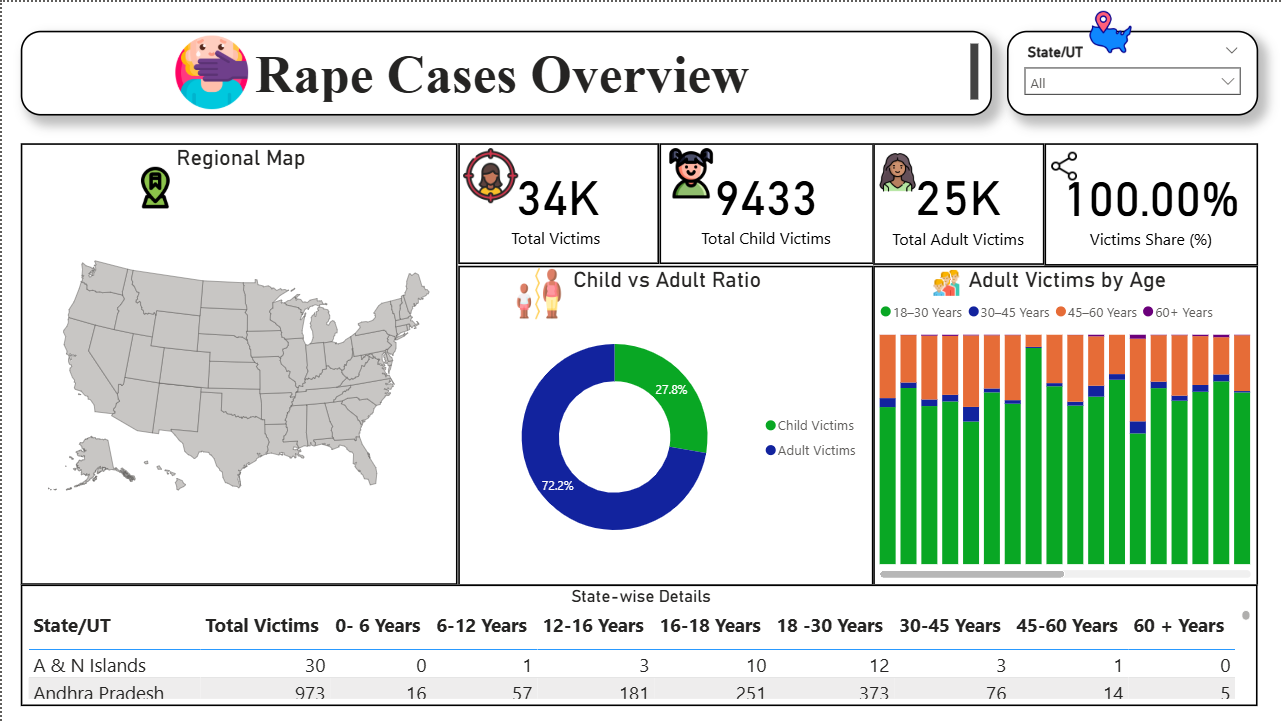
Analyse sensitive crime data with this Rape Cases Analysis Power BI dashboard template designed to track case trends and outcomes. This Rape Cases Analysis Power BI dashboard template highlights key metrics such as total registered cases, conviction rates, arrest rates, escape percentages, re-arrest outcomes, and victim distribution by age and category. It also enables users to examine case progression, demographic patterns, and regional variations over time. This Rape Cases Analysis Power BI dashboard template is ideal for policymakers, law enforcement agencies, and researchers who need to monitor crime patterns and improve public safety strategies. It helps identify high-risk regions, evaluate enforcement effectiveness, and support informed decision-making. The dashboard includes funnel charts for case lifecycle tracking, bar and stacked charts for demographic and state comparisons, donut charts for category distribution, maps for regional analysis, and tables for detailed case-level insights. Interactive filters allow flexible exploration across time, location, and categories. Download this Rape Cases Analysis Power BI dashboard template and start analysing crime trends and safety insights effectively.
Interactive Demo Available
Explore this dashboard live in Power BI
Category
Templates
Chart Types
Bar, Line, Map, Donut
Industry Types
Education, Public Safety
Main Colors
#FFFFFF
Mode
light
Version
Free
PBIX File
🔑 Sign in to Download