Published
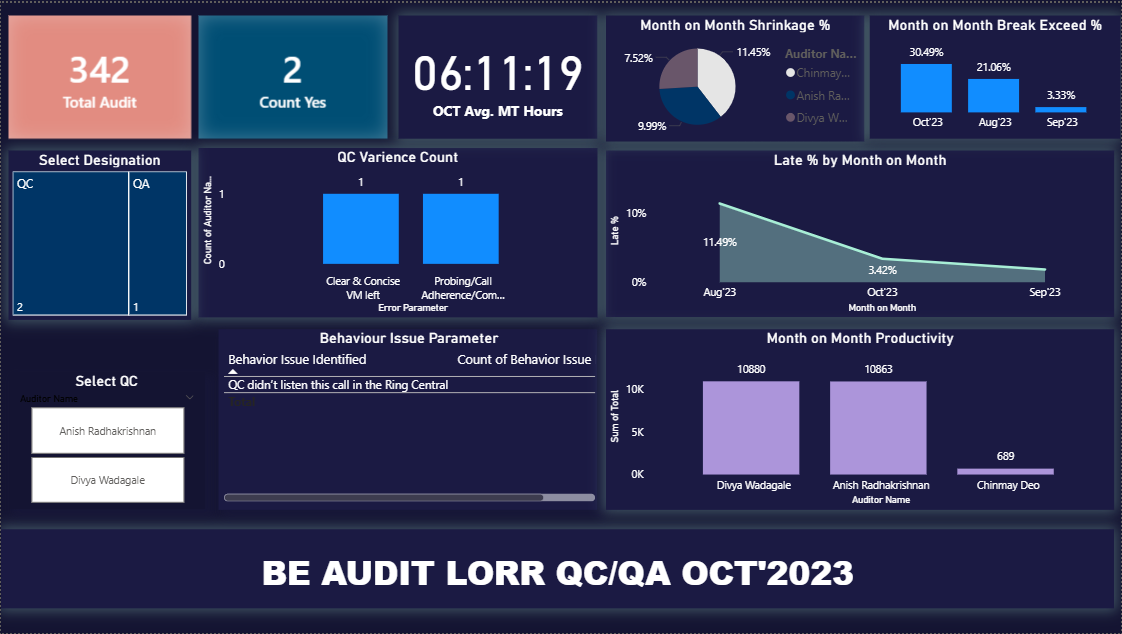
The Quality Audit Power BI Dashboard Template helps track audit performance, quality compliance, and productivity metrics for QC and QA teams. This Quality Audit Power BI Dashboard Template includes key metrics such as total audits, average handling time, variance counts, behavior issues, and productivity indicators to evaluate operational performance effectively. It also highlights month-on-month trends including shrinkage, break exceed percentage, and late percentage. Designed for quality managers, operations teams, and audit analysts, this Quality Audit Power BI Dashboard Template helps monitor team performance, improve compliance, and identify areas for process improvement. It solves challenges related to tracking audit outcomes and managing productivity across teams. The dashboard includes visuals such as audit trend charts, productivity graphs, compliance performance visuals, and KPI cards for quick insights. Interactive filters allow users to explore data by designation and QC auditor for detailed analysis. Download this Quality Audit Po
Interactive Demo Available
Explore this dashboard live in Power BI
Category
Templates
Chart Types
Line, Area, Donut
Industry Types
Healthcare
Main Colors
Blue, #141432
Mode
dark
Version
Pro
PBIX File
🔑 Sign in to DownloadBuy this Dashboard