Published
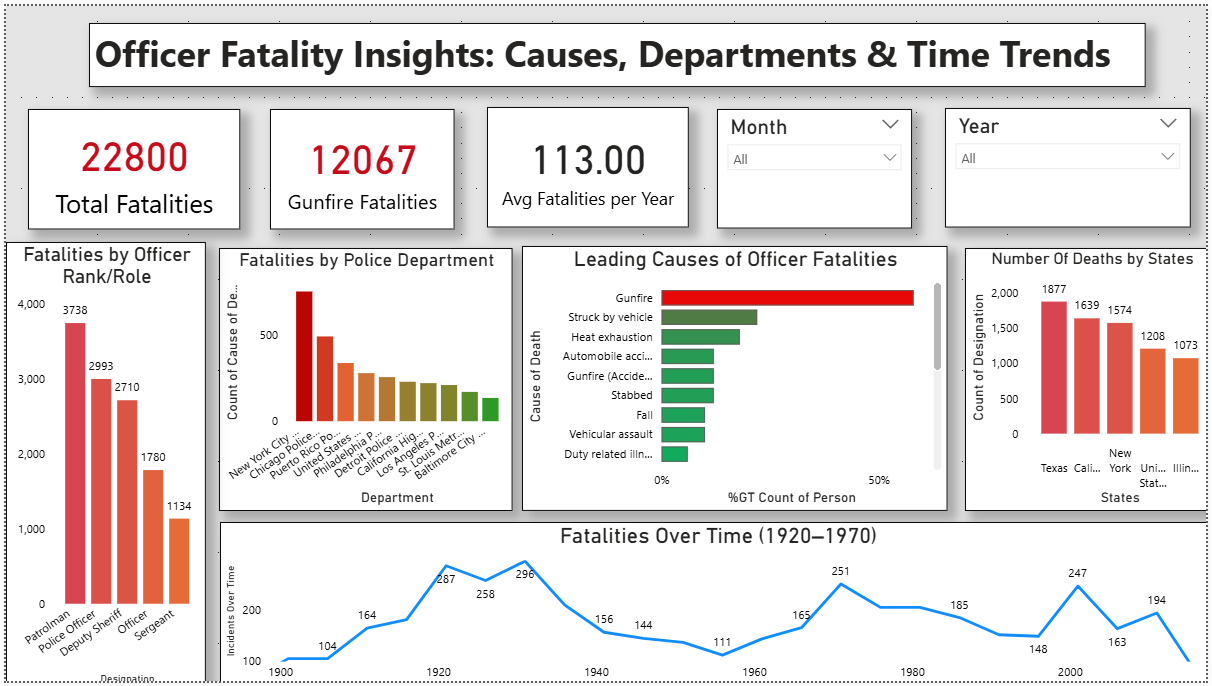
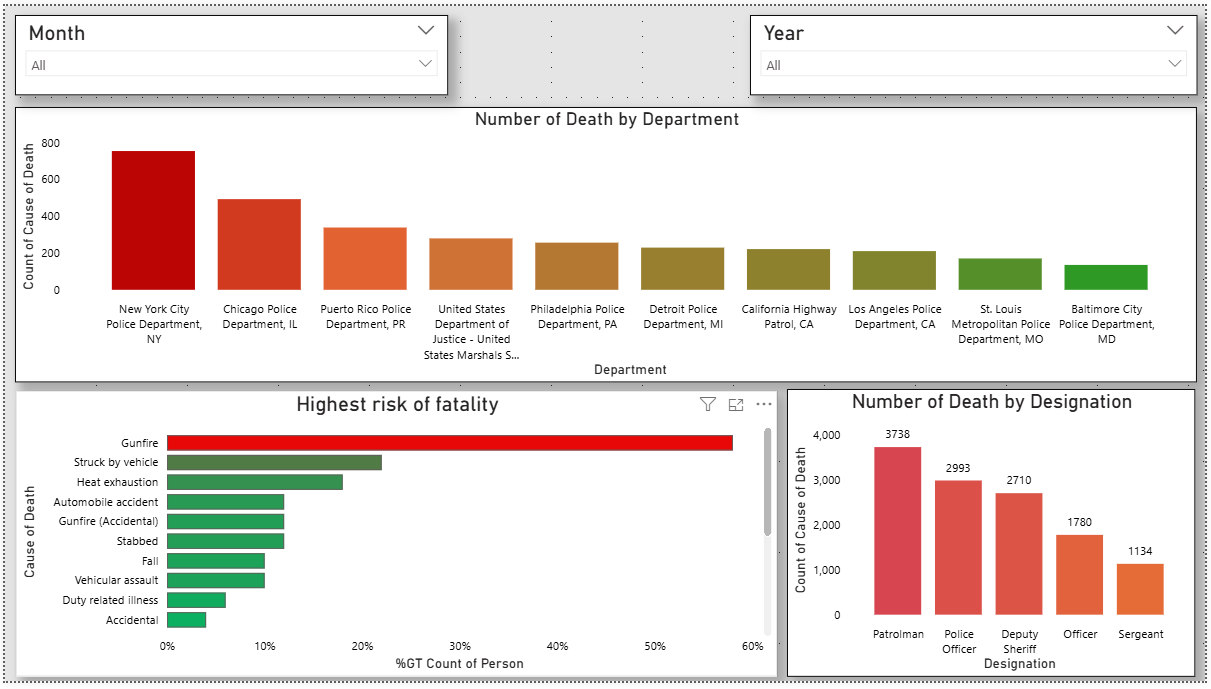
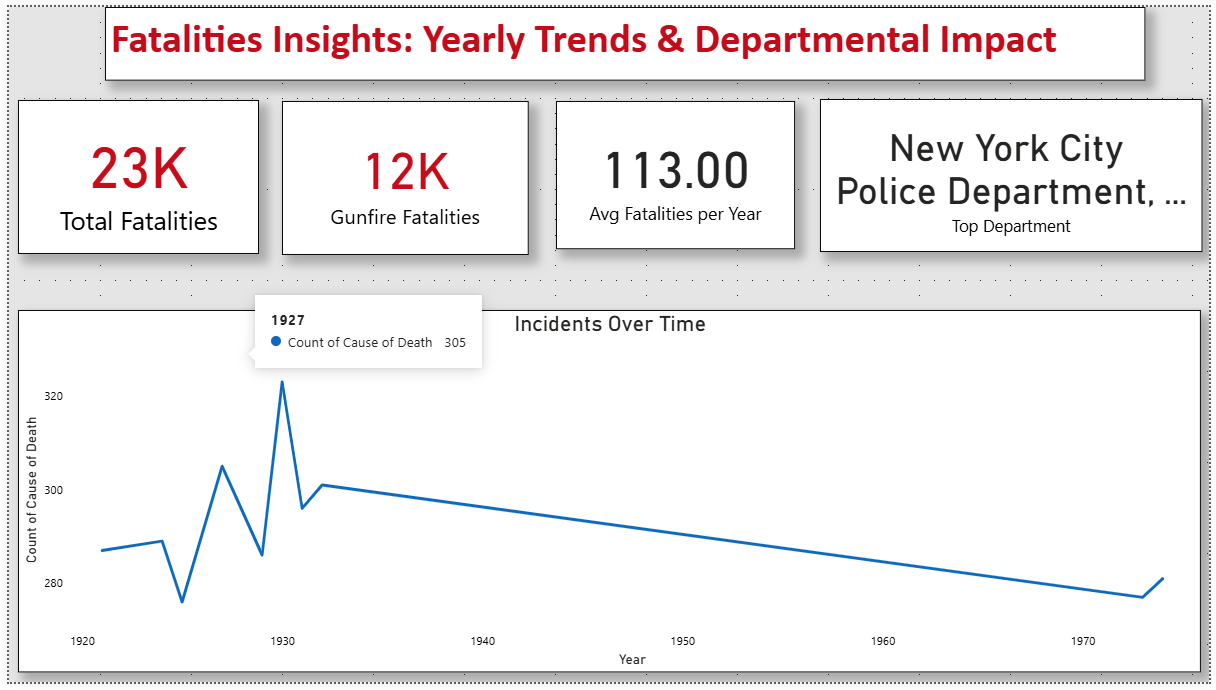
The Public Safety Power BI Dashboard Template helps analyze officer fatalities, causes of death, and risk patterns across departments and regions. This Public Safety Power BI Dashboard Template includes key metrics such as total fatalities, average fatalities per year, and leading causes of death to evaluate safety trends effectively. It also highlights department-wise impact, designation-level risk, and state-wise fatality distribution. Designed for public safety agencies, analysts, and policy makers, this Public Safety Power BI Dashboard Template helps identify high-risk roles, monitor incident trends, and support safety planning. It solves challenges related to understanding fatality patterns and evaluating risk factors across regions and departments. The dashboard includes visuals such as cause-of-death distribution charts, geographic maps, time-based trend analysis, and department-level comparison graphs. Interactive drill-through and filters allow users to explore data by state, department, and designation for deeper insights. Download this Public Safety Power BI Dashboard Template and start analysing officer fatality trends and risk patterns today.
Interactive Demo Available
Explore this dashboard live in Power BI
Category
Templates
Chart Types
Bar, Line
Industry Types
Healthcare, Education
Main Colors
#DBDBDB
Mode
light
Version
Free
PBIX File
🔑 Sign in to Download