Published
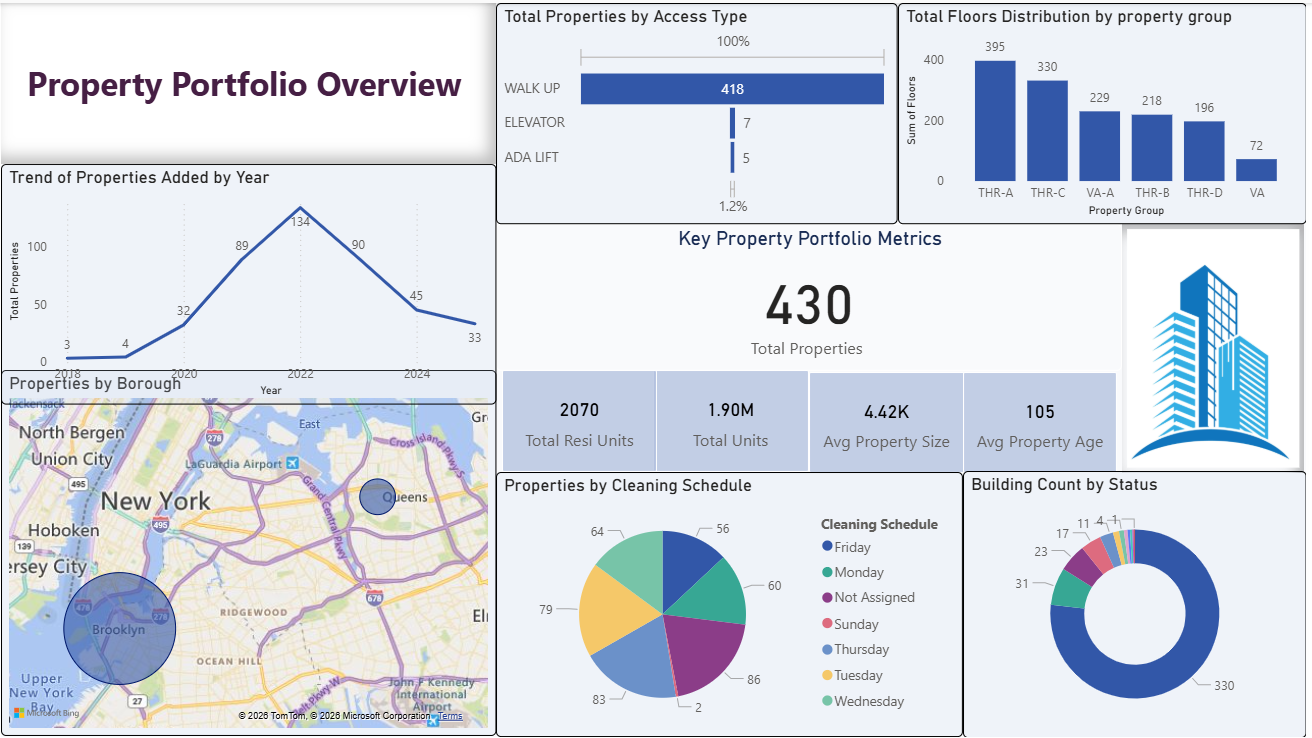
Monitor real estate assets with this Real Estate Portfolio Power BI dashboard template designed to track property composition and portfolio performance. This Real Estate Portfolio Power BI dashboard template highlights key metrics such as total properties, residential units, total units, average property size, and average property age. It also provides insights into property distribution by access type, building status, property group, and cleaning schedules to support operational planning. This Real Estate Portfolio Power BI dashboard template is ideal for property managers, real estate analysts, and asset managers who need a clear view of portfolio structure and performance. It helps track portfolio growth, evaluate asset distribution, and support informed investment and maintenance decisions. The dashboard includes trend charts for properties added over time, geographic maps for borough-level distribution, category breakdown visuals, and KPI cards for quick insights. Interactive filters allow users to explore property data dynamically across multiple dimensions. Download this Real Estate Portfolio Power BI dashboard template and start managing your property assets and portfolio performance effectively.
Interactive Demo Available
Explore this dashboard live in Power BI
Category
Templates
Chart Types
Bar, Line, Pie, Donut
Industry Types
Marketing, Real Estate
Main Colors
#EFF3F9
Mode
light
Version
Pro
PBIX File
🔑 Sign in to DownloadBuy this Dashboard