Published
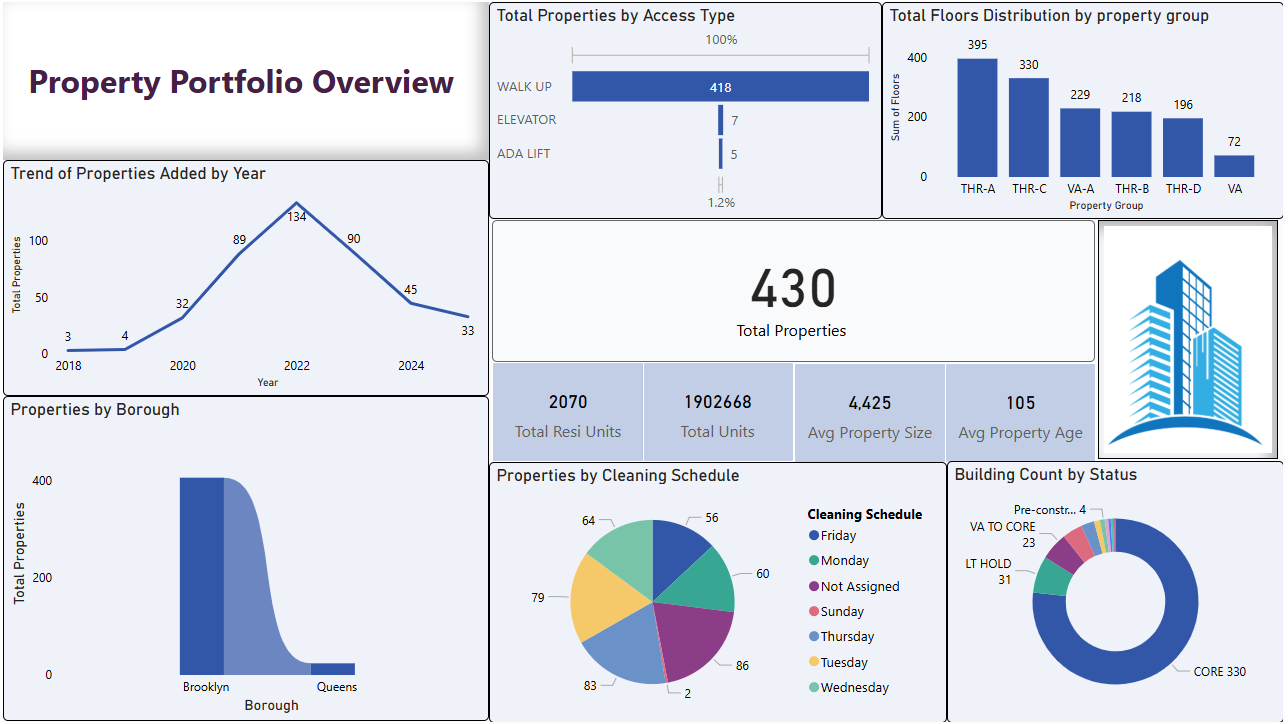
The Property Portfolio Overview Dashboard provides a comprehensive view of property assets, operational distribution, and portfolio performance across multiple property groups and geographic locations. It analyzes key metrics such as total properties, residential units, total units, average property size, and average property age to help stakeholders understand overall portfolio scale and composition. The dashboard highlights trends in properties added over time, access type distribution (walk-up, elevator, ADA lift), and total floor distribution by property group, enabling operational and infrastructure analysis. Additional insights include property distribution by borough, building status breakdown, and cleaning schedule allocation to support maintenance planning and operational efficiency. Interactive visuals allow users to evaluate asset growth, property characteristics, and management activities, helping organizations make informed decisions related to property portfolio strategy, resource allocation, and facility operations.
Interactive Demo Available
Explore this dashboard live in Power BI
Category
Templates
Chart Types
Bar, Line, Pie, Donut
Industry Types
Real Estate
Main Colors
Blue
Mode
light
Version
Pro
Total Views
11
Total Downloads
4
PBIX File
🔑 Sign in to DownloadPBIT File
🔑 Sign in to DownloadOpen in Studio
🔑 Sign in to Open Studio
System Briqlab
System Briqlab
Skills