Published
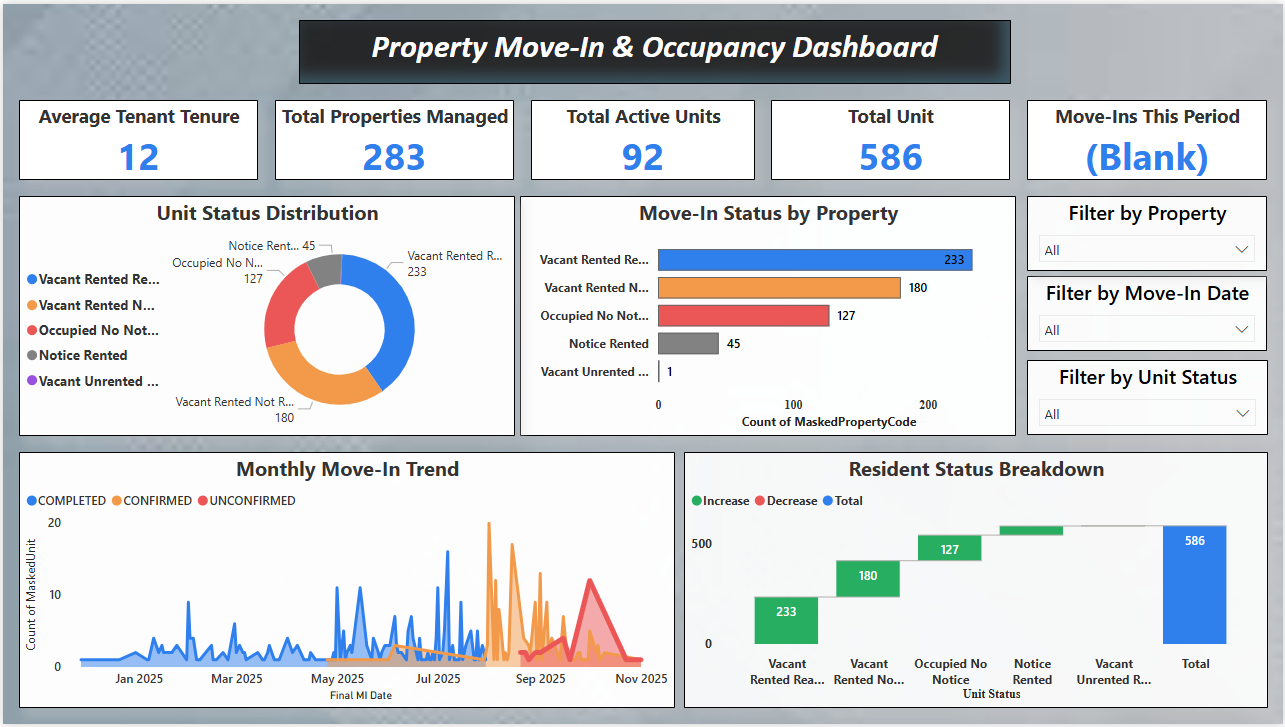
The Property Occupancy Power BI Dashboard Template helps track tenant movement, unit status distribution, and occupancy performance across properties. This Property Occupancy Power BI Dashboard Template includes key metrics such as average tenant tenure, total properties managed, active units, total units, and move-in activity to evaluate leasing performance effectively. It also highlights occupancy categories such as vacant rented, occupied without notice, notice rented, and vacant unrented units. Designed for property managers, leasing teams, and real estate analysts, this Property Occupancy Power BI Dashboard Template helps monitor vacancy trends, improve tenant retention, and optimize occupancy strategies. It solves challenges related to tracking tenant flow and understanding unit availability across properties. The dashboard includes visuals such as monthly move-in trend charts, resident status breakdowns, occupancy distribution graphs, and KPI cards for quick insights. Interactive filters allow users to explore data by property, move-in date, and unit status for deeper analysis. Download this Property Occupancy Power BI Dashboard Template and start analysing occupancy performance and tenant trends today.
Interactive Demo Available
Explore this dashboard live in Power BI
Category
Templates
Chart Types
Bar, Area, Donut
Industry Types
Real Estate
Main Colors
#B8BBC0
Mode
light
Version
Pro
PBIX File
🔑 Sign in to DownloadBuy this Dashboard