Published
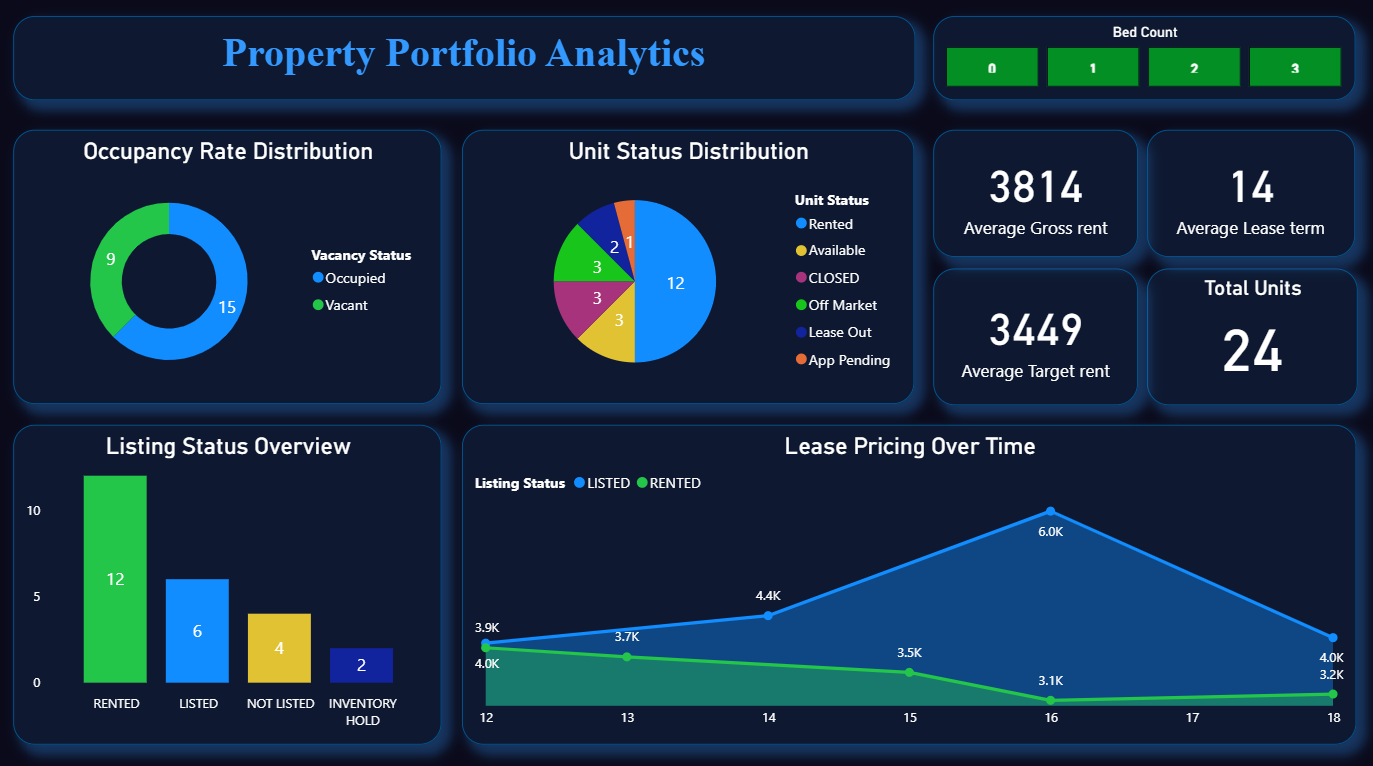
The Property Analytics Power BI Dashboard Template helps analyze rental performance, occupancy status, and unit availability across residential properties. This Property Analytics Power BI Dashboard Template includes key metrics such as average gross rent, target rent, lease term, and total units to evaluate portfolio performance effectively. It also highlights occupancy distribution, unit status breakdown, and listing activity across properties. Designed for property managers, leasing teams, and real estate analysts, this Property Analytics Power BI Dashboard Template helps identify vacancies, monitor rental trends, and optimize pricing strategies. It solves challenges related to tracking property performance and understanding occupancy patterns across units. The dashboard includes visuals such as rental trend charts, occupancy distribution graphs, listing status visuals, and KPI cards for quick insights. Interactive filters allow users to explore data by property, lease term, and time period for deeper analysis. Download this Property Analytics Power BI Dashboard Template and start analysing rental performance and occupancy trends today.
Interactive Demo Available
Explore this dashboard live in Power BI
Category
Templates
Chart Types
Bar, Line, Pie, Area, Donut
Industry Types
Real Estate
Main Colors
Blue, #174EC5
Mode
dark
Version
Pro
PBIX File
🔑 Sign in to DownloadBuy this Dashboard