Published
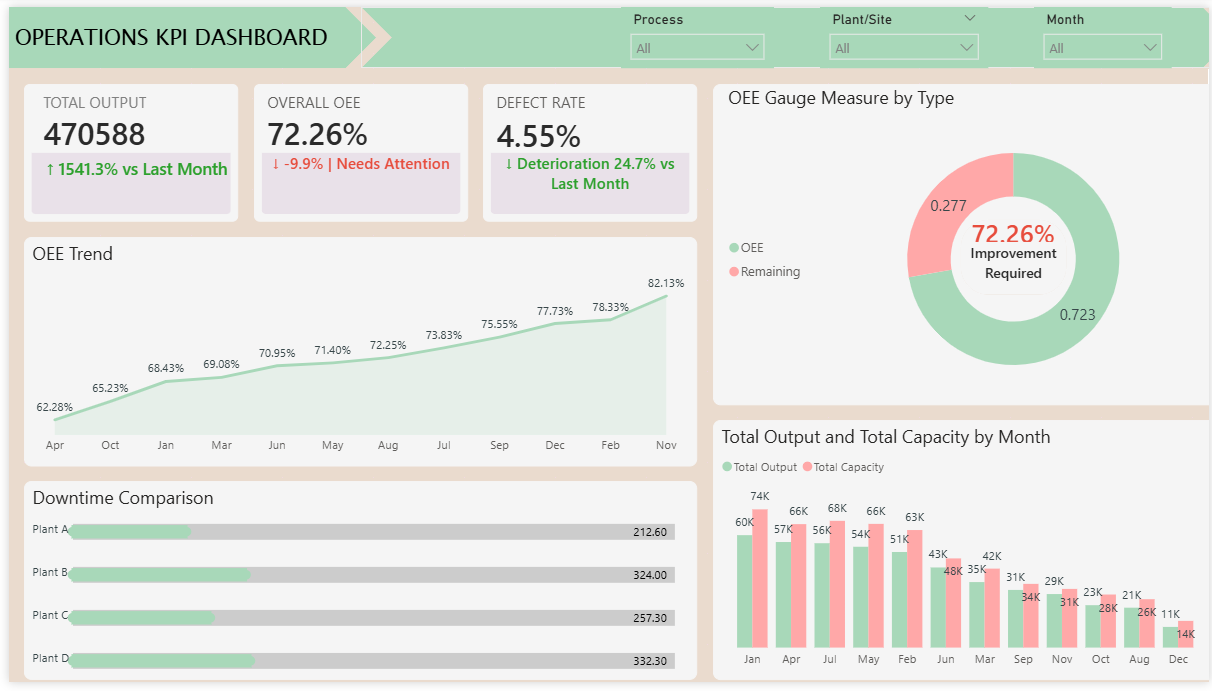
Summary The Briqlab Manufacturing Operations KPI Dashboard is a professional-grade Power BI solution engineered for Plant Managers, Production Supervisors, and Continuous Improvement teams who require a high-impact view of factory floor performance. This dashboard transforms complex production data into actionable manufacturing intelligence, providing a unified hub to monitor efficiency, minimize downtime, and scale output across multiple facilities. Key Operations Performance Metrics Core Manufacturing KPIs: Instant visibility into Total Production Output, Overall Equipment Effectiveness (OEE), and Defect Rates for an immediate pulse on plant health. OEE Trend Analysis: Month-over-month efficiency tracking to monitor the success of lean manufacturing initiatives and continuous improvement projects. Capacity Utilization Benchmarking: Data-driven comparison of Total Output vs. Total Capacity to identify underutilized resources and production bottlenecks. Downtime Comparative Analysis: Precision tracking of downtime across different plants and sites to pinpoint underperforming facilities and mechanical friction points. Quality Control & Defect Mapping: Granular monitoring of defect rates segmented by specific processes and plants to drive Six Sigma and quality assurance efforts. Multi-Site Drill-Down: Interactive filtering by Process, Plant, and Month, allowing leadership to move from a global overview to floor-level specifics in seconds. Make it Yours Download this Briqlab template to access the underlying DAX formulas and data architecture. Designed for seamless integration with ERP systems, IoT sensors, or Excel-based production logs, you can simply plug in your own manufacturing data to start optimizing your plant performance today.
Interactive Demo Available
Explore this dashboard live in Power BI
Category
Templates
Chart Types
Bar, Line, Donut
Industry Types
Education
Main Colors
Green
Mode
light
Version
Pro
PBIX File
🔑 Sign in to DownloadBuy this Dashboard