Published
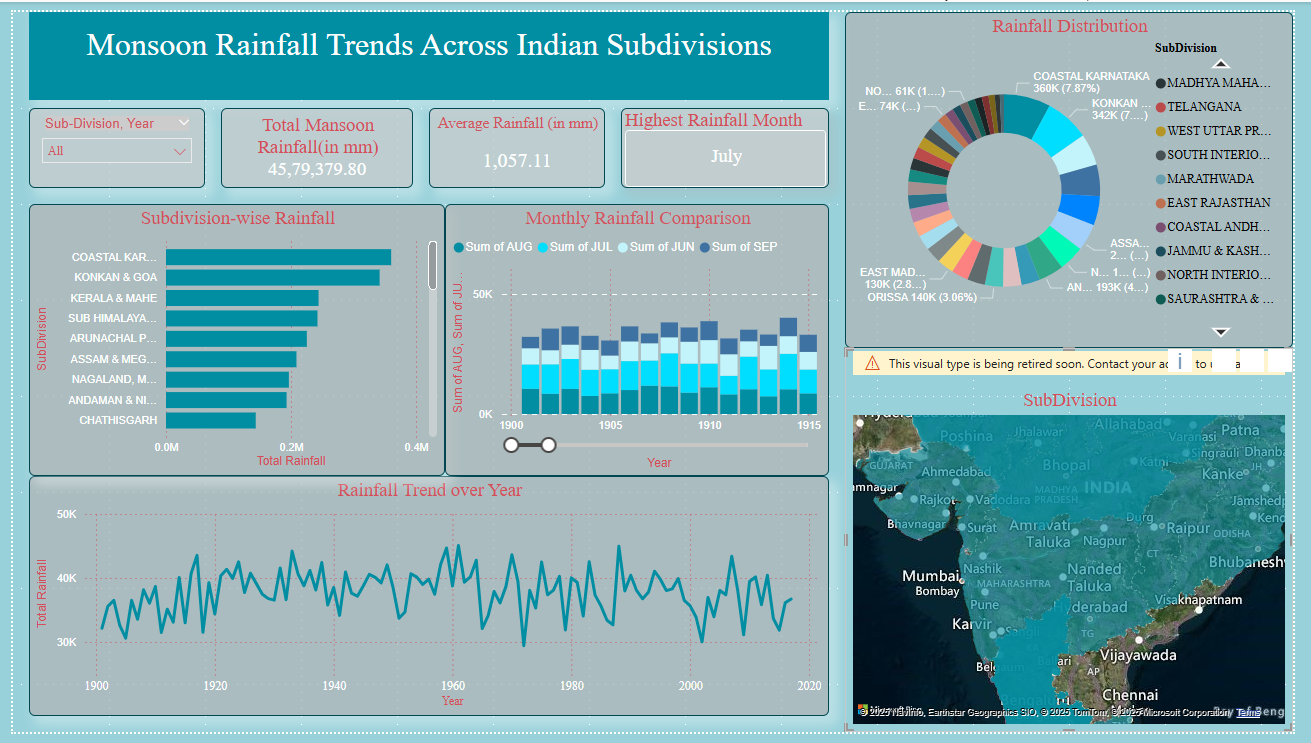
The Monsoon Rainfall Power BI Dashboard Template helps analyze rainfall patterns across Indian subdivisions and track seasonal climate trends over time. This Monsoon Rainfall Power BI Dashboard Template includes key metrics such as total monsoon rainfall, average rainfall levels, and highest rainfall month to evaluate seasonal performance effectively. It also highlights subdivision-wise comparisons, monthly rainfall distribution, and long-term trends to identify climate variability and anomalies. Designed for climate researchers, agricultural planners, and environmental analysts, this Monsoon Rainfall Power BI Dashboard Template helps understand regional rainfall differences, support crop planning, and improve disaster preparedness. It addresses challenges related to scattered climate data and difficulty in identifying rainfall trends across regions. The dashboard includes visuals such as rainfall distribution charts, subdivision comparison graphs, monthly trend analysis, and an interactive geographical map of India. Time-based filters allow users to explore historical patterns and seasonal variations in detail. Download this Monsoon Rainfall Power BI Dashboard Template and start analysing rainfall trends and climate patterns today.
Interactive Demo Available
Explore this dashboard live in Power BI
Category
Templates
Chart Types
Bar, Line, Map, Donut
Industry Types
Education, Entertainment & Media
Main Colors
#C3C9C9
Mode
light
Version
Free
PBIX File
🔑 Sign in to Download