Published
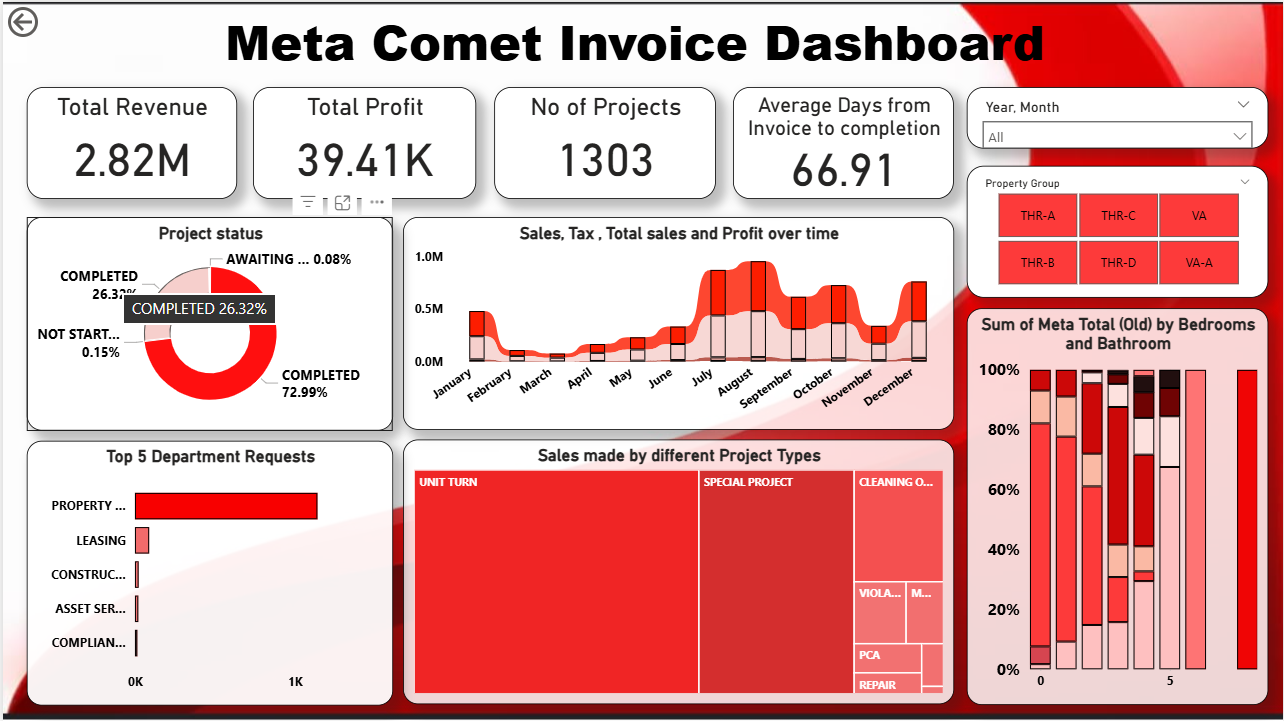
The Project Invoicing Power BI Dashboard Template helps track project revenue, profit, invoice timelines, and overall project performance in one place. This Project Invoicing Power BI Dashboard Template includes key metrics such as total revenue, total profit, project volume, invoice completion timelines, and project status to evaluate financial performance effectively. It also highlights monthly trends in sales, tax, and profit along with revenue contribution across project types and property configurations. Designed for finance teams, project managers, and business analysts, this Project Invoicing Power BI Dashboard Template helps monitor billing efficiency, identify high-performing projects, and improve financial planning. It solves challenges related to tracking invoicing performance and understanding revenue distribution across departments. The dashboard includes visuals such as monthly trend charts, revenue breakdown graphs, departmental performance charts, and KPI cards for quick insights. Interactive filters allow users to explore data by project type, department, and time period for deeper analysis. Download this Project Invoicing Power BI Dashboard Template and start analysing your revenue, profit, and invoicing performance today.
Interactive Demo Available
Explore this dashboard live in Power BI
Category
Templates
Chart Types
Bar, Area, Tree Map / Hierarchical Chart, Donut
Industry Types
Real Estate
Main Colors
Red
Mode
light
Version
Pro
PBIX File
🔑 Sign in to DownloadBuy this Dashboard