Published
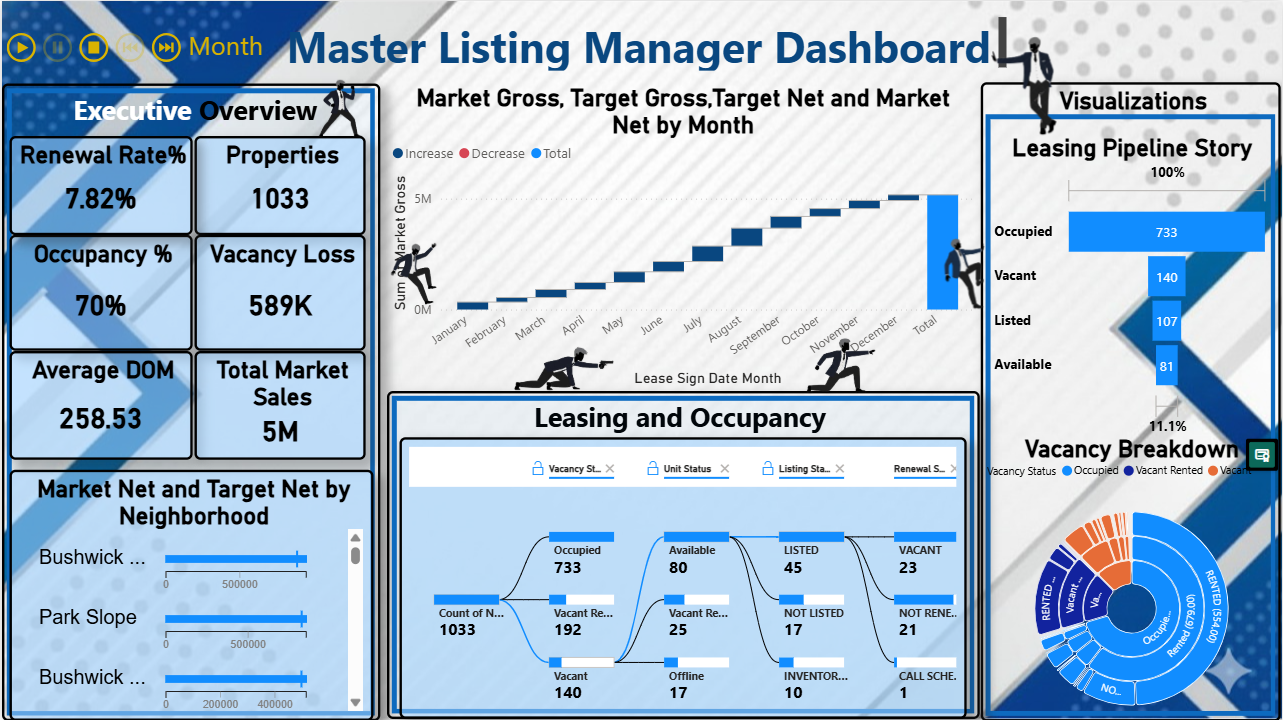
The Property Portfolio Power BI Dashboard Template helps track occupancy, leasing performance, vacancy loss, and pricing trends across real estate portfolios. This Property Portfolio Power BI Dashboard Template includes key metrics such as occupancy rate, renewal rate, vacancy loss, leasing pipeline status, and market gross versus target net performance to evaluate portfolio health. It also highlights unit-level leasing status, vacancy breakdowns, and neighborhood performance comparisons. Designed for property managers, asset managers, and real estate analysts, this Property Portfolio Power BI Dashboard Template helps optimize leasing strategies, reduce vacancy loss, and improve revenue performance. It solves challenges related to tracking portfolio performance and identifying underperforming properties. The dashboard includes visuals such as leasing pipeline charts, vacancy breakdown graphs, occupancy trend visuals, and neighborhood comparison charts. Interactive filters allow users to explore data by property, location, and time period for deeper insights. Download this Property Portfolio Power BI Dashboard Template and start analysing leasing performance and occupancy trends today.
Interactive Demo Available
Explore this dashboard live in Power BI
Category
Templates
Chart Types
Bar, Donut
Industry Types
Real Estate
Main Colors
Blue, #FFFFFF
Mode
light
Version
Pro
PBIX File
🔑 Sign in to DownloadBuy this Dashboard