Published
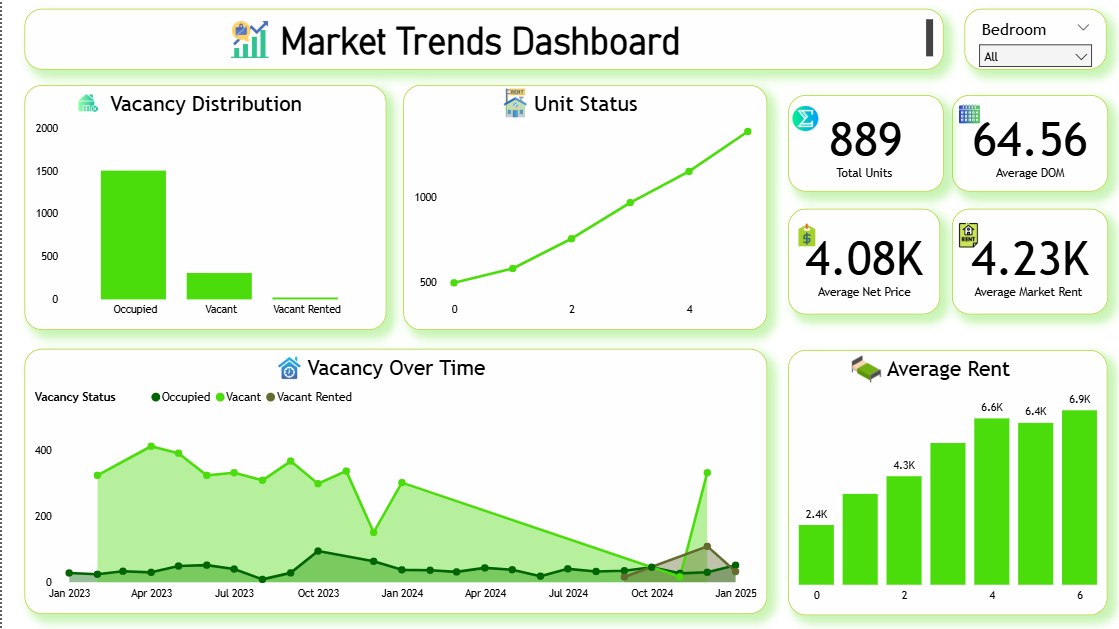
The Market Trends Dashboard Template helps track property performance, vacancy trends, and rental pricing across a real estate portfolio. This Real Estate Market Power BI Dashboard Template includes key metrics such as total units, average days on market, average net price, and average market rent to evaluate property performance effectively. It also highlights vacancy status, unit lifecycle progression, and rent distribution by bedroom category. Designed for real estate managers, property analysts, and leasing teams, this Real Estate Market Power BI Dashboard Template helps optimize pricing strategies, reduce vacancy rates, and improve occupancy planning. It solves challenges related to tracking property performance and understanding market demand shifts. The dashboard includes visuals such as vacancy trend charts, unit status timelines, rent comparison by bedroom type, and KPI cards for quick insights. Time-based visuals and interactive filters allow users to explore data across different periods and property segments. Download this Real Estate Market Power BI Dashboard Template and start analysing rental performance and vacancy trends today.
Interactive Demo Available
Explore this dashboard live in Power BI
Category
Templates
Chart Types
Bar, Line
Industry Types
Real Estate
Main Colors
Green, #ABD125
Mode
light
Version
Free
Total Views
41
Total Downloads
8
PBIX File
🔑 Sign in to DownloadPBIT File
🔑 Sign in to DownloadOpen in Studio
🔑 Sign in to Open Studio
System Briqlab
System Briqlab
Skills