Published
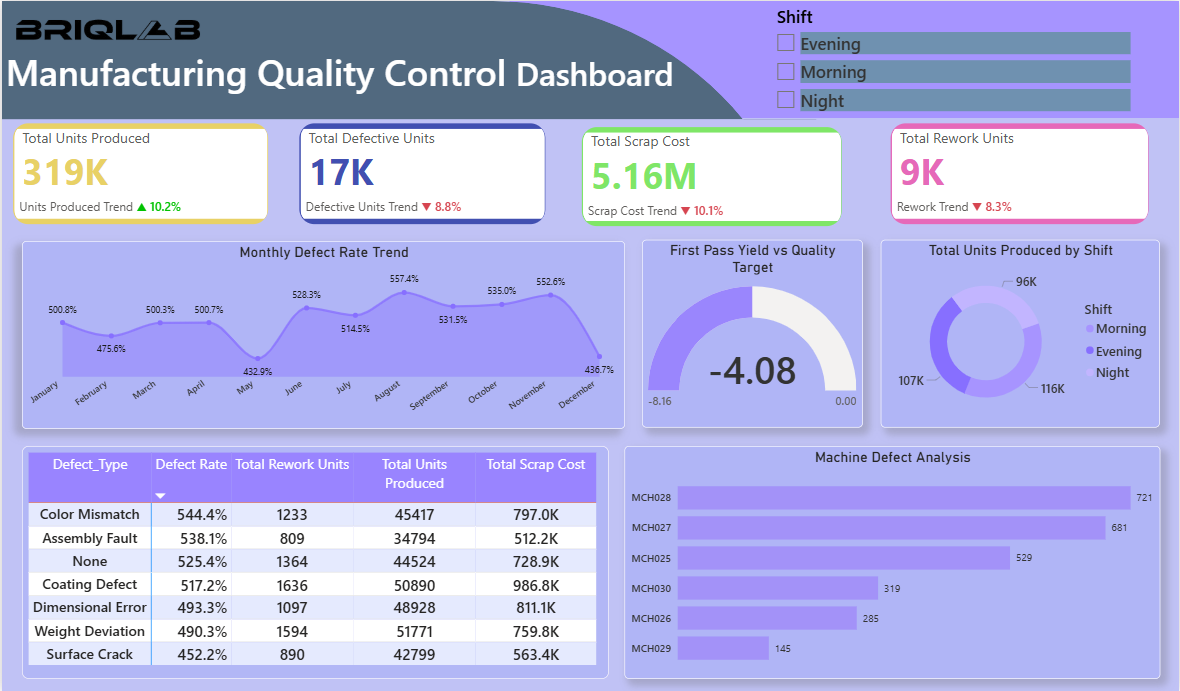
This dashboard provides a comprehensive overview of manufacturing production quality and operational performance. It tracks key metrics such as total units produced, defective units, scrap costs, and rework units to evaluate overall production efficiency. The dashboard analyzes monthly defect trends, first pass yield against quality targets, and production output across different shifts. Additionally, it provides detailed insights into defect types and machine-level defect analysis, helping quality managers identify root causes of production issues and optimize manufacturing processes. By monitoring these indicators, organizations can improve product quality, reduce waste, and enhance operational efficiency.
Category
Templates
Chart Types
Bar, Line, Gauge, Donut
Industry Types
Automotive
Main Colors
Blue, Green, #A7A9D6
Mode
light
Version
Pro
PBIX File
🔑 Sign in to DownloadBuy this Dashboard