Published
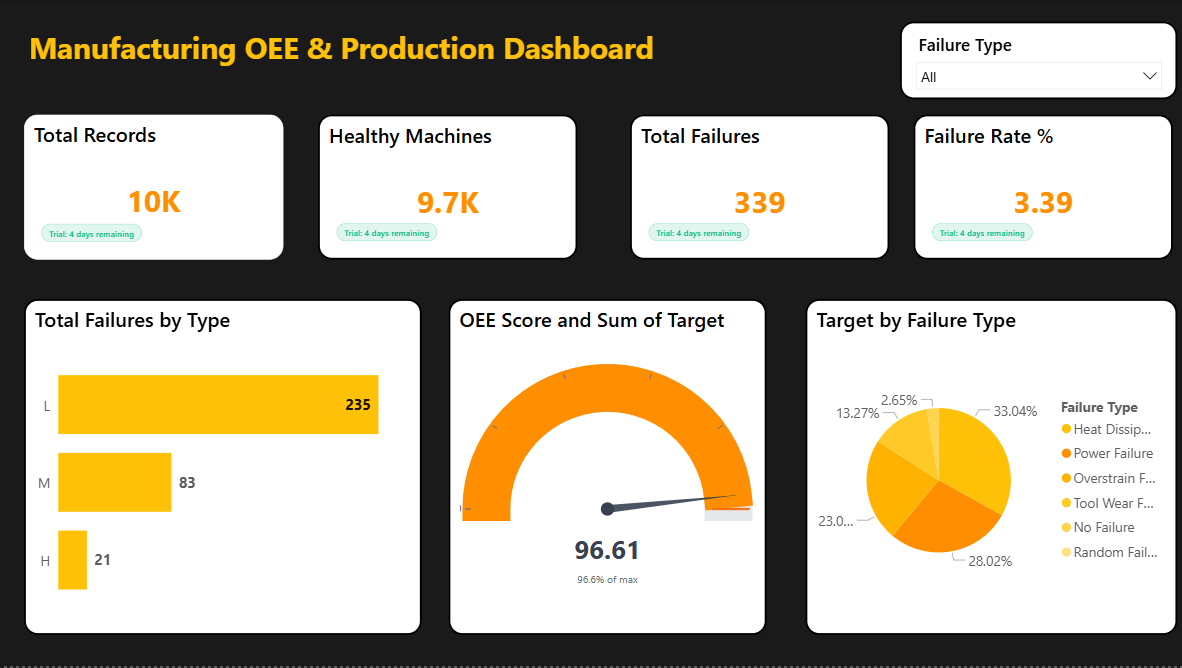
Summary The Briqlab Manufacturing OEE & Production Dashboard is a high-performance Power BI solution engineered to transform shop floor data into actionable industrial intelligence. This dashboard provides real-time visibility into production efficiency and equipment health, enabling plant managers to minimize downtime and maximize manufacturing throughput with precision. Key Production Performance Metrics OEE Master KPIs: Instant tracking of Overall Equipment Effectiveness (OEE), broken down by Availability, Performance, and Quality. Production Output Monitoring: Real-time visualization of total units produced versus targets to ensure daily manufacturing goals are met. Downtime Root Cause Analysis: Detailed breakdown of planned vs. unplanned downtime to pinpoint bottlenecks and mechanical inefficiencies. Reject & Scrap Rate Tracking: Granular analysis of quality losses to reduce waste and optimize raw material utilization. Shift & Machine Benchmarking: Comparative performance views across different work shifts and production lines to identify high-performing assets. Cycle Time Analysis: Precision monitoring of machine speeds to identify micro-stoppages and optimize production velocity. Make it Yours Download this Briqlab template to access the underlying DAX formulas and data architecture. Simply plug in your own IoT sensor data, ERP exports, or manufacturing logs to start optimizing your production efficiency today.
Interactive Demo Available
Explore this dashboard live in Power BI
Category
Templates
Chart Types
Bar, Pie, Gauge
Industry Types
Finance, Retail
Main Colors
Yellow
Mode
dark
Version
Pro
PBIX File
🔑 Sign in to DownloadBuy this Dashboard