Published
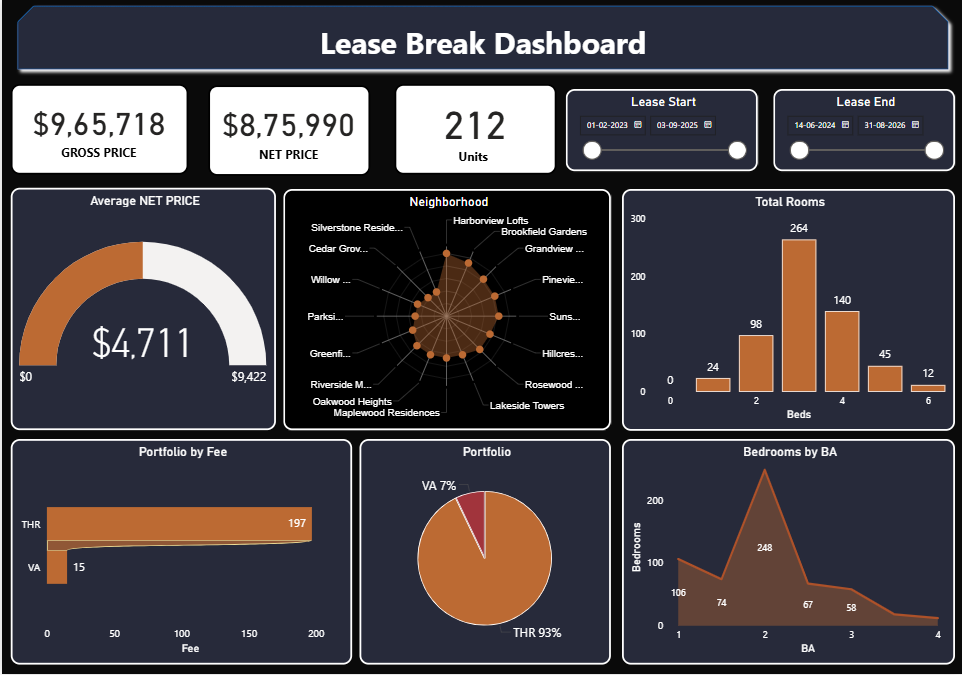
The Lease Management Power BI Dashboard Template helps analyze lease break trends, pricing performance, and portfolio distribution across properties. This Lease Management Power BI Dashboard Template includes key metrics such as gross price, net price, total units, and average net rent to evaluate leasing performance effectively. It also highlights room and bedroom distribution, neighborhood-level impact, and portfolio split across locations. Designed for property managers, leasing teams, and real estate analysts, this Lease Management Power BI Dashboard Template helps identify lease break patterns, assess portfolio risk, and optimize pricing strategies. It solves challenges related to tracking lease disruptions and understanding their financial impact. The dashboard includes visuals such as pricing comparison charts, unit distribution graphs, neighborhood analysis visuals, and portfolio split breakdowns. Interactive date filters allow users to explore lease break trends over time for deeper insights. Download this Lease Management Power BI Dashboard Template and start analysing lease break performance and pricing trends today.
Interactive Demo Available
Explore this dashboard live in Power BI
Category
Templates
Chart Types
Bar, Line, Gauge, Area, Donut
Industry Types
Real Estate
Main Colors
#272A3A
Mode
dark
Version
Pro
PBIX File
🔑 Sign in to DownloadBuy this Dashboard