Published
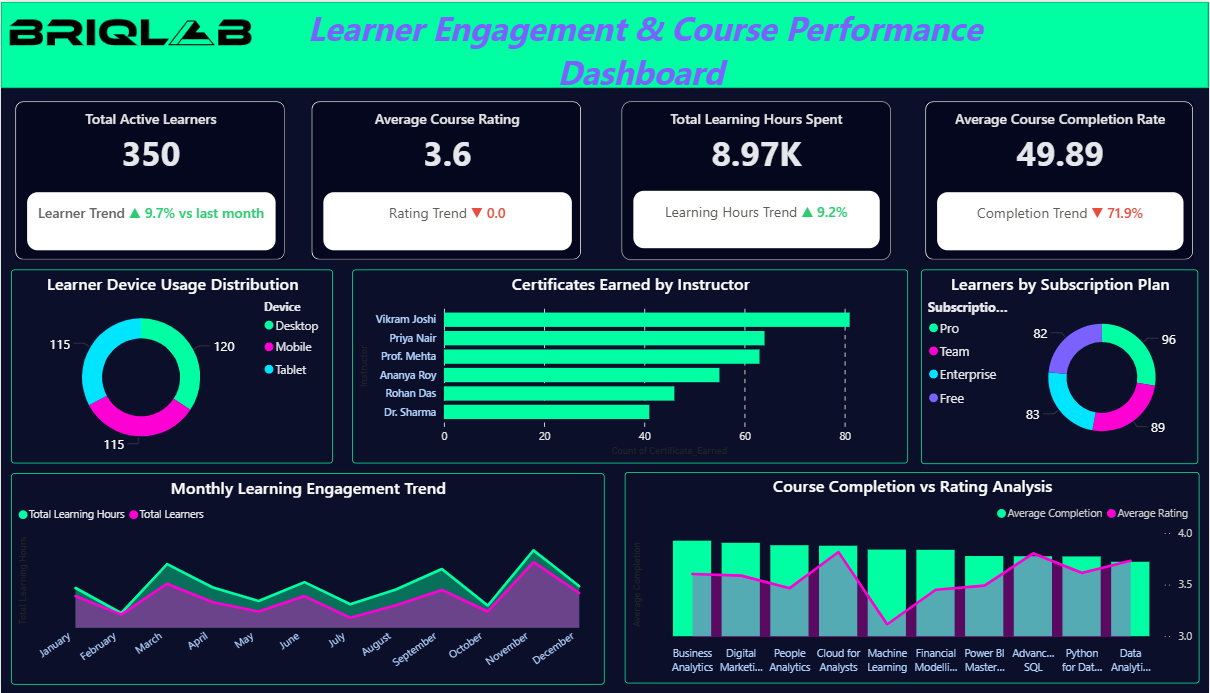
This dashboard provides a comprehensive overview of learner engagement and course performance within an online learning platform. It highlights key metrics such as total active learners, average course ratings, total learning hours, and course completion rates to evaluate overall learning effectiveness. The visualizations analyze learner device usage, subscription plan distribution, instructor performance through certificates earned, and monthly engagement trends.
Category
Templates
Chart Types
Bar, Line, Donut
Industry Types
Education
Main Colors
Blue, Green, #18E2A0
Mode
dark
Version
Pro
PBIX File
🔑 Sign in to DownloadBuy this Dashboard