Published
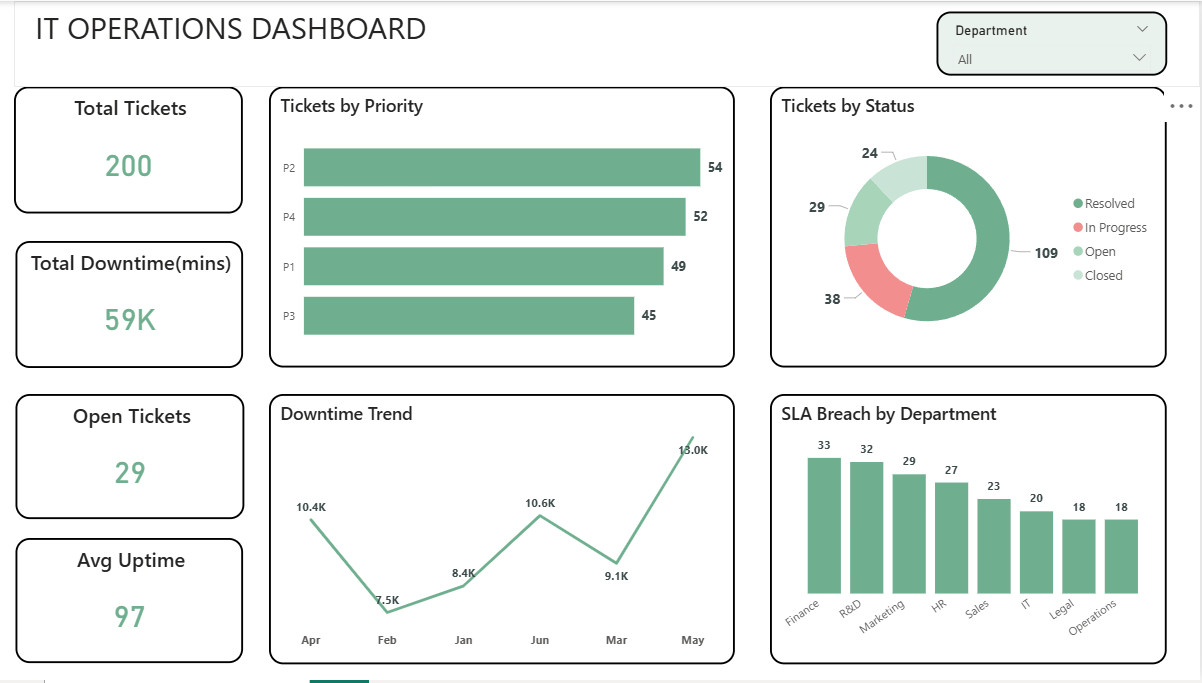
Summary The Briqlab IT Operations Dashboard is a high-performance Power BI solution engineered for IT Managers, Service Desk Leads, and CIOs who require real-time visibility into infrastructure health. This dashboard transforms fragmented ITSM data into actionable IT intelligence, allowing you to monitor incident volume, system uptime, and SLA compliance within a single, unified interface. Key IT Performance Metrics Incident Management KPIs: Instant snapshots of total incidents by priority (P1–P4) and category to ensure rapid response to critical failures. SLA Compliance Tracking: Data-driven monitoring of breach rates and resolution times to maintain high service standards and accountability. System Reliability Analytics: Precision tracking of Mean Time to Resolve (MTTR), MTBF, and uptime percentages across all core applications. Technician Performance Benchmarking: Visual analysis of ticket load distribution and individual performance to optimize support team efficiency. Service Sentiment (CSAT): Integrated Customer Satisfaction scores by department and category to evaluate end-user experience. Strategic Trend Analysis: Identification of recurring technical issues and planned vs. unplanned downtime patterns to drive proactive system improvements. Make it Yours Download this Briqlab template to access the underlying DAX formulas and data architecture. Designed for seamless integration with ServiceNow, Freshservice, Jira, or BMC Remedy, you can simply plug in your own ITSM data to start optimizing your IT service delivery today.
Interactive Demo Available
Explore this dashboard live in Power BI
Category
Templates
Chart Types
Bar, Pie
Industry Types
Information Technology
Main Colors
Green
Mode
light
Version
Pro
PBIX File
🔑 Sign in to DownloadBuy this Dashboard